4
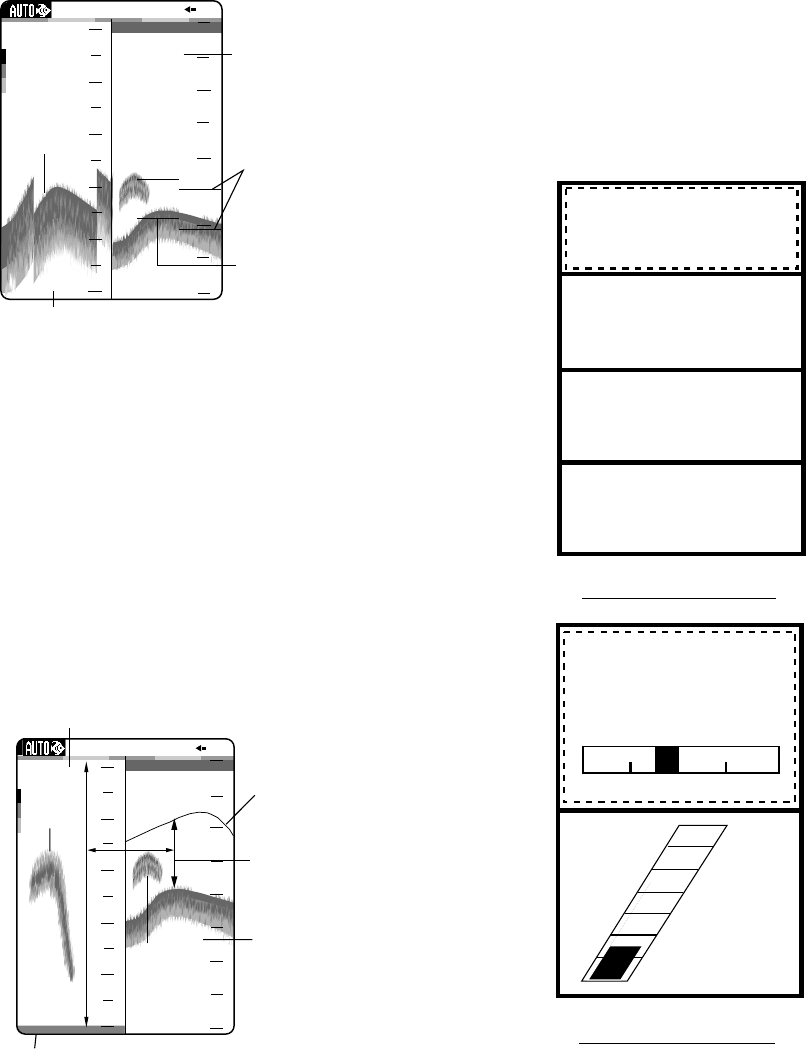
Bottom-zoom display
This mode expands bottom and bottom fish
in the range width set with ZOOM RANGE
on page 3 of the SYSTEM menu. This
mode is useful for determining bottom
contour.
0
Bottom-zoom display
29.8
Bottom
0
40
10
20
30
32
31
30
29
28
27
Switched with
depth
Single
frequency
display
Zoom
marker
0.0
50k
1/1
Bottom-zoom display
Bottom-lock display
The bottom-lock display provides a normal
picture on the right half of the screen and a
15 feet (5 meter)* wide layer in contact with
the bottom is expanded onto the left half of
the screen. This mode is useful for
detecting bottom fish.
* = Operator selectable
Bottom-lock display
Zoom
marker
Zoomed
fish
This section
is zoomed
21.7
0
Single
frequency
display
Fish
school
0
40
Bottom displayed flat
10
20
30
0
1
2
3
4
5
50k
1/1
Bottom-lock display
Nav data displays
The nav data displays appear on the left
2/3 of the screen. Data other than depth
requires appropriate sensor.
You can display between two and four
items in a nav data display and choose the
item and order and to display them. See
paragraph 1.23 to choose the items to
display and “NAV DATA-1” and “NAV
DATA-2” in paragraph 2.1 to choose the
number of items to display.
Depth
69.4
m
Trip meter
10.0
nm
Odometer
56
nm
NAV DATA-1 display
NAV DATA-2 display
Temperature
65.5
°F
17.2
1 0.5 0 0.5 1
0.25
nm
XTE
Speed
kt
20
50
40
60
30
10
0
Sample NAV DATA displays


