


2
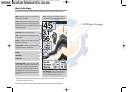
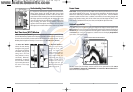
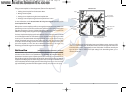
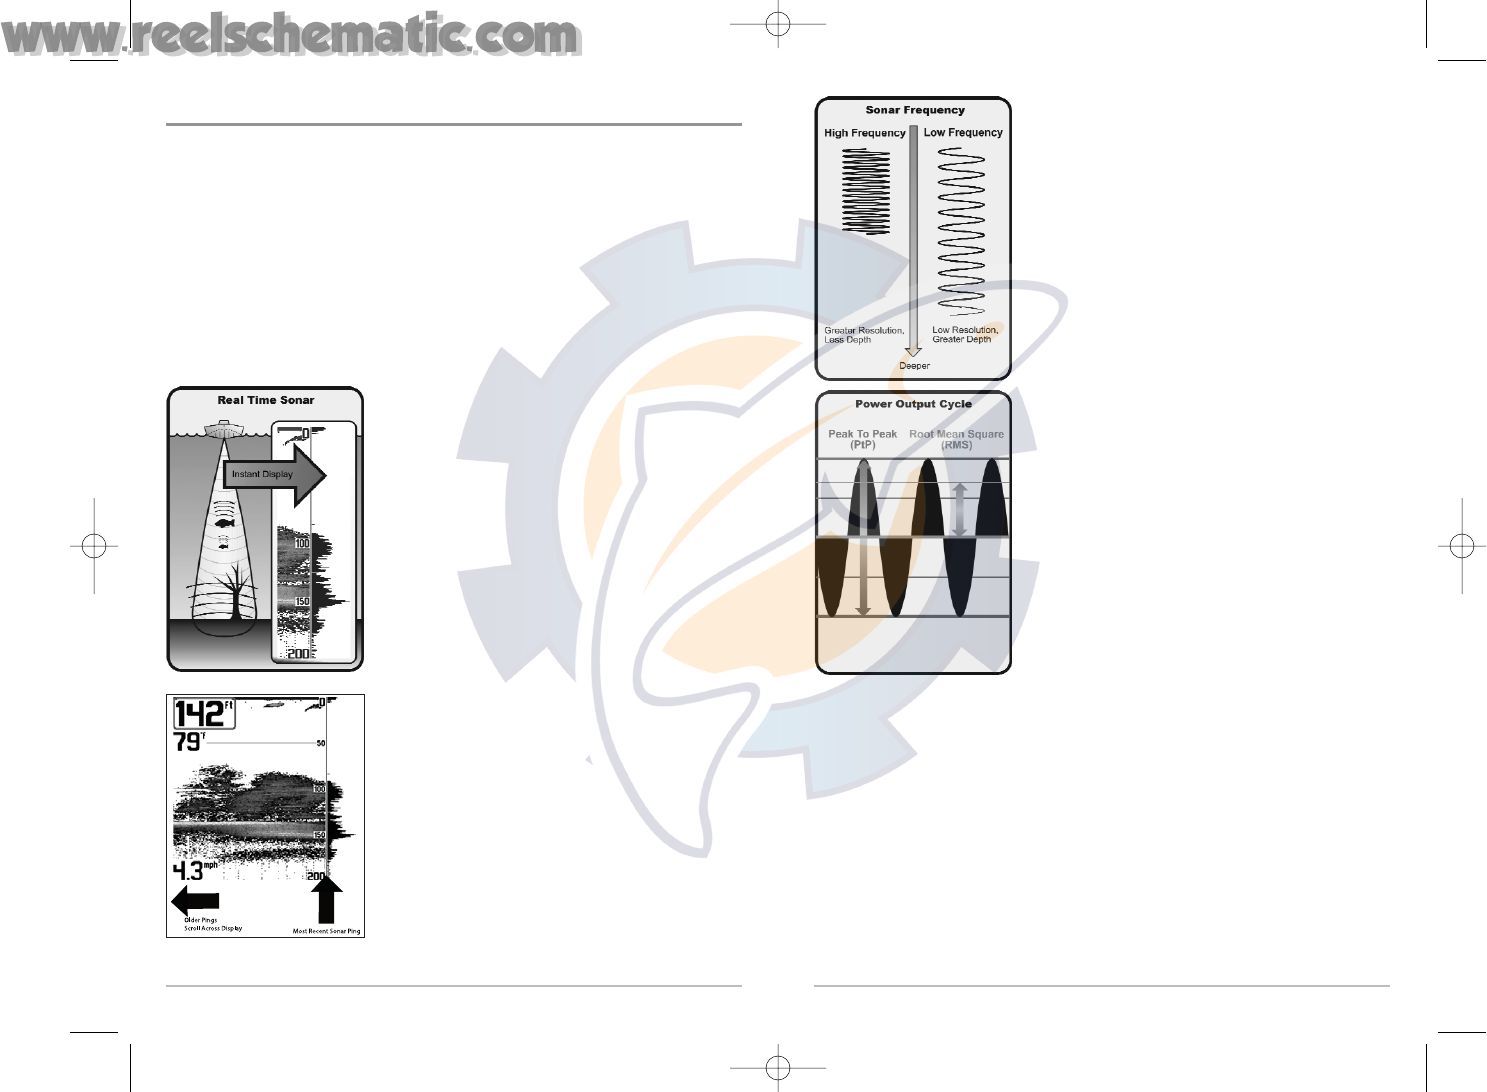
The sound pulses are transmitted at various frequencies
depending on the application. Very high frequencies (455kHz)
are used for greatest definition but the operating depth is
limited. High frequencies (200kHz) are commonly used on
consumer sonar and provide a good balance between depth
performance and resolution. Low frequencies (83kHz) are
typically used to achieve greater depth capability.
The power output is the amount of energy generated by the
sonar transmitter. It is commonly measured using two
methods:
• Root Mean Square (RMS) measures power output over
the entire transmit cycle.
• Peak to Peak measures power output at the highest
points.
The benefits of increased power output are the ability to
detect smaller targets at greater distances, ability to
overcome noise, better high speed performance and
enhanced depth capability.
1
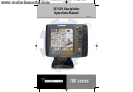
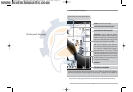
How Sonar Works
Sonar technology is based on sound waves. The 700 Series™ Fishing System uses sonar to
locate and define structure, bottom contour and composition, as well as depth directly below
the transducer.
Your 700 Series™ Fishing System sends a sound wave signal and determines distance by
measuring the time between the transmission of the sound wave and when the sound wave is
reflected off of an object; it then uses the reflected signal to interpret location, size, and
composition of an object.
Sonar is very fast. A sound wave can travel from the surface to a depth of 240 ft
(70 m) and back again in less than 1/4 of a second. It is unlikely that your boat can "outrun"
this sonar signal.
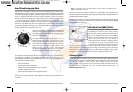
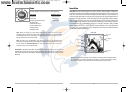
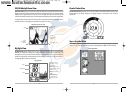
SONAR is an acronym for SOund and NAvigation Ranging.
Sonar utilizes precision sound pulses or "pings" which are
emitted into the water in a teardrop-shaped beam.
The sound pulses "echo" back from objects in the water such
as the bottom, fish and other submerged objects. The
returned echoes are displayed on the LCD screen. Each time a
new echo is received, the old echoes are moved across the LCD,
creating a scrolling effect.
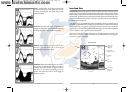
When all the echoes are viewed side by side, an easy to
interpret "graph" of the bottom, fish and structure appears.
531427-1_C - 767_Man_Eng.qxd 10/25/2005 10:29 AM Page 8