


1101 and 1102 Secure Device Servers
724-746-5500 | blackbox.com
100
Refer to the sample Nagios configuration section below for some examples of configuring specific NSCA checks.
10.3.4 Configure Selected Serial Ports for Nagios Monitoring
The individual Serial Ports connected to the console server to be monitored must be configured for Nagios checks. See Chapter 10 for details on
enabling Nagios monitoring for Hosts that are network connected to the console server. To enable Nagios to monitor a device connected to the
console server serial port:
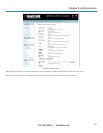
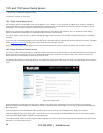
Select Serial & Network: Serial Port and click Edit on the serial Port # you want to monitor.
Select Enable Nagios, specify the name of the device on the upstream server and determine the check you want to run on this port. Serial Status
monitors the handshaking lines on the serial port and Check Port monitors the data logged for the serial port.
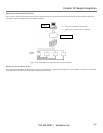
10.3.5 Configure Selected Network Hosts for Nagios Monitoring
The individual Network Hosts connected to the console server that you want to monitor must also be configured for Nagios checks:
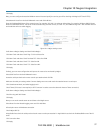
Select Serial & Network: Network Port and click Edit on the Network Host you want to monitor.
Select Enable Nagios, specify the name of the device as it will appear on the upstream Nagios server.
Click New Check to add a specific check which will be run on this host.
Select Check Permitted TCP/UDP to monitor a service that you have previously added as a Permitted Service.
Select Check TCP/UDP to specify a service port that you want to monitor, without allowing external (SDT Connector) access.
Select Check TCP to monitor.
The Nagios Check nominated as the check-host-alive check is the check used to determine whether the network host itself is up or down.
Typically this will be Check Ping—although in some cases the host will be configured not to respond to pings.
If no check-host-alive check is selected, the host will always be assumed to be up.
You may deselect check-host-alive by clicking Clear check-host-alive.
If required, customize the selected Nagios Checks to use custom arguments.
Click Apply.
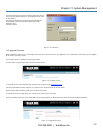
10.3.6 Configure the Upstream Nagios Monitoring Host
Refer to the Nagios documentation (http://www.nagios.org/docs/
) for configuring the upstream server:
The section entitled Distributed Monitoring steps through what you need to do to configure NSCA on the upstream server (under Central Server
Configuration).
NRPE Documentation was recently added that steps through configuring NRPE on the upstream server
http://nagios.sourceforge.net/docs/nrpe/NRPE.pdf
.
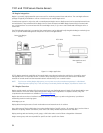
At this stage, Nagios at the upstream monitoring server is configured, and individual serial port and network host connections on the console server
are configured for Nagios monitoring. If NSCA is enabled, each selected check will be executed once over the period of the check interval. If NRPE is
enabled, then the upstream server will be able to request status updates under its own scheduling.
10.4 Advanced Distributed Monitoring Configuration
10.4.1 Sample Nagios Configuration
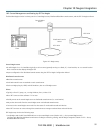
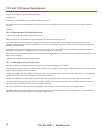
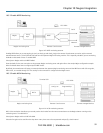
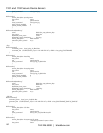
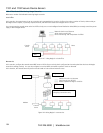
An example configuration for Nagios is listed below. It shows how to set up a remote Console server to monitor a single host, with both network
and serial connections. For each check it has two configurations, one each for NRPE and NSCA. In practice, these would be combined into a single
check which used NSCA as a primary method, falling back to NRPE if a check was late— for details, see the Nagios documentation
(http://www.nagios.org/docs/
) on Service and Host Freshness Checks
.
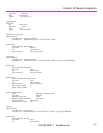
; Host definitions
;
; Black Box console server
define host{
use generic-host