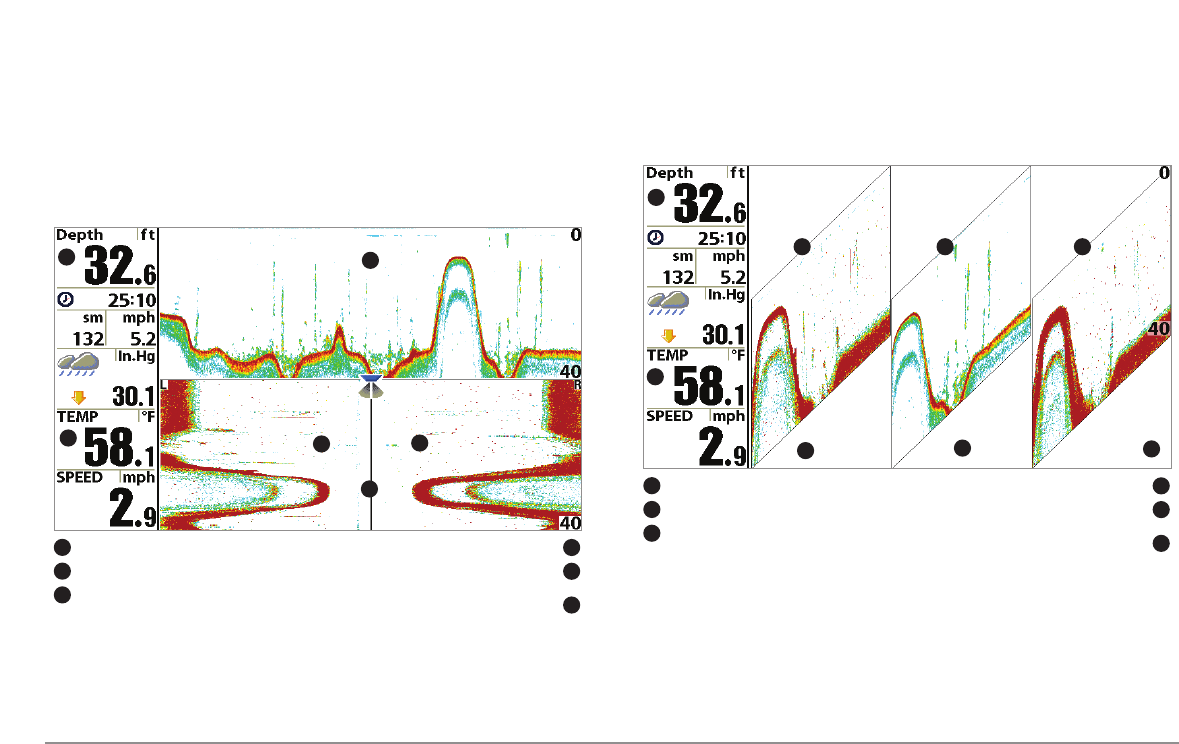
Classic layout: The top portion of the display presents a historical log of
sonar returns from the 200 kHz down-looking sonar beam. New information
in the down beam panel scrolls from right to left. The bottom portion of the
display presents a historical log of sonar returns from the 455 kHz right- and
left-looking sonar beams. New information appears at the top, and scrolls
down the display.
Slanted layout: This layout presents the two 455 kHz side sonar beams and
the 200 kHz down-looking sonar beam as three panels of historical data. This
layout is presented as three slanted panels. New information appears on the
right, and scrolls to the left.
In all of these layouts, the sonar information from the side-looking beams
reveals bottom contour, structure and fish similar to the down-looking beam,
but the area covered is to the left and right of the area shown in the down-
looking portion, so you actually see more of the bottom. The distance
covered by the right and left beams is based on the depth setting for the
down-looking beam, up to a maximum of 160 feet.
Side Beam View, Slanted Layout
Depth
200 kHz Sonar History Window
1
5
1
4
Temperature
2
5
Left Side 455 kHz Sonar History Window
Right Side 455 kHz Sonar History Window
3
6
4
Water Surface Line for 455 kHz
Sonar History Windows
2
3
6
55
Side Beam View, Classic Layout
Depth
200 kHz Sonar History Window
1
5
1
4
Temperature
2
5
Right Side 455 kHz Sonar History Window
6
3
4
Water Surface Line for 455 kHz
Sonar History Windows
2
6
Left Side 455 kHz Sonar History Window
3
49


