


Northstar Explorer 657 Installation and Operation Manual42
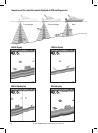
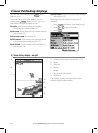
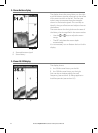
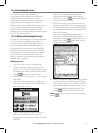
9-3 Sonar Bottom display
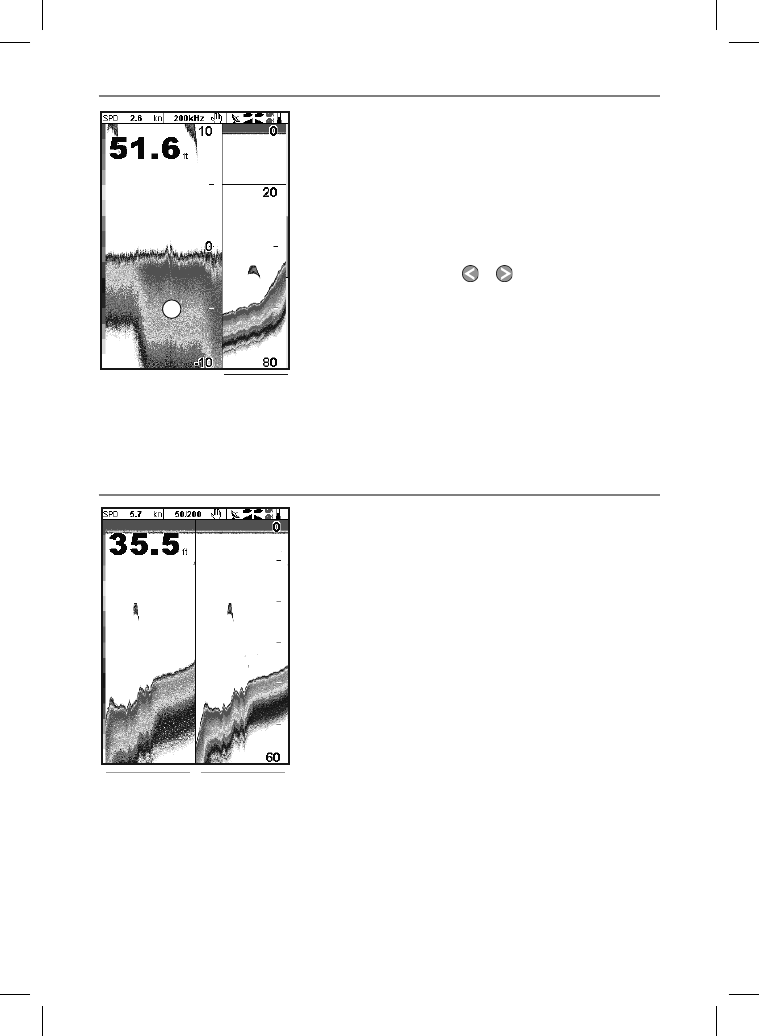
The display shows the sonar history on the right
and the bottom signal as a flat trace in the center
of the zoom section on the left. The flat trace
make it easy to compare the echo strengths
shown in the bottom signals. This can help to
identify the type of bottom and objects close to
the bottom.
The zoom bar on the far right shows the area of
the history that is magnified in the zoom section:
• Use the
or keys to adjust the zoom
range.
• The 657 calculates the zoom depth
automatically.
It is not necessary to turn Bottom lock on for this
display.
A Zoomed bottom signal
B Sonar history
A
B
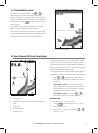
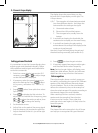
9-4 Sonar 50/200 display
The display shows:
A the 50 kHz sonar history on the left
B the 200 kHz sonar history on the right.
Gain can be set independently for each
frequency (see section 8-6). Range applies to
both frequencies (see section 8-5).
A
B