


Chapter 10: Nagios Integration
724-746-5500 | blackbox.com
97
Click Apply.
Next, you must configure the attached Window network host and specify the services you will be checking with Nagios (HTTP and HTTPS):
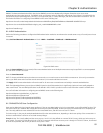
Select Network Hosts from the Serial & Network menu and click Add Host.
Enter the IP Address/DNS Name of the network server, for example: 192.168.1.10 and enter a Description, for example: Windows 2003 IIS Server.
Remove all Permitted Services. This server will be accessible using Terminal Services, so check TCP, Port 3389 and log level 1 and click Add. Remove
and re-add the service to enable logging.
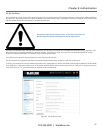
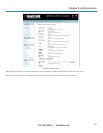
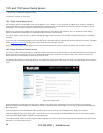
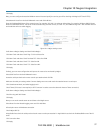
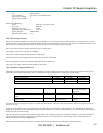
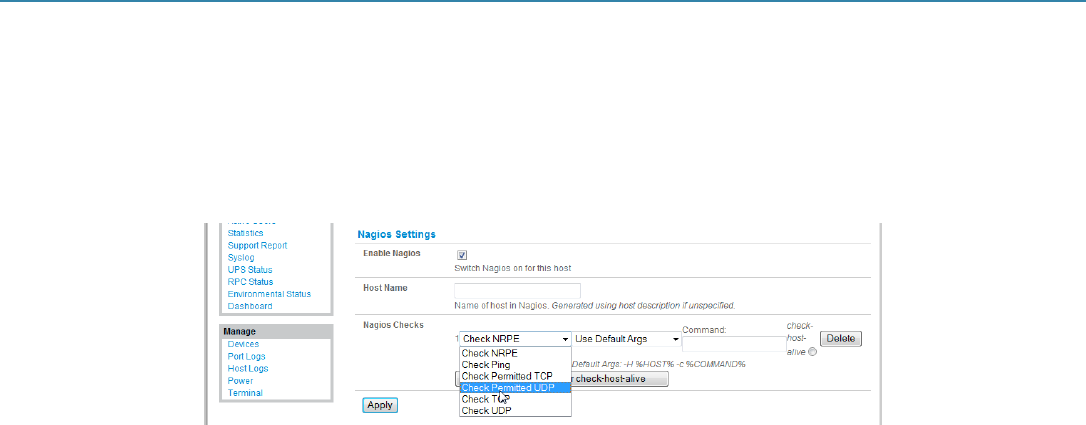
Figure 10-4. Nagios settings screen.
Scroll down to Nagios Settings and check Enable Nagios.
Click New Check and select Check Ping. Click check-host-alive.
Click New Check and select Check Permitted TCP. Select Port 3389
Click New Check and select Check TCP. Select Port 80.
Click New Check and select Check TCP. Select Port 443.
Click Apply.
Similarly, you now must configure the serial port to the router to be monitored by Nagios:
Select Serial Port from the Serial & Network menu.
Locate the serial port that has the router console port attached and click Edit.
Make sure the serial port settings under Common Settings are correct and match the attached router’s console port.
Click Console server Mode, and select Logging Level 1.
Check Telnet (SSH access is not required, as SDT Connector is used to secure the otherwise insecure Telnet connection).
Scroll down to Nagios Settings and check Enable Nagios.
Check Port Log and Serial Status.
Click Apply.
Now you can set the console server to send alerts to the Nagios server:
Select Alerts from the Alerts & Logging menu and click Add Alert.
In Description enter: Administrator connection.
Check Nagios (NSCA).
In Applicable Ports check the serial port that has the router console port attached. In Applicable Hosts check the IP address/DNS name of the IIS
server.
Click Connection Alert.
Click Apply.