


Beam Select
Beam Select sets which sonar returns from
the transducer will be displayed on the screen.
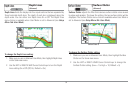
When set to 200/83 kHz, the returns from both beams are blended. The Split
Sonar View continues to display the sonar returns from each beam in their
respective windows. The blended information is shown in the Sonar View.
The RTS® Window in the Sonar View will only show the returns from the
200 kHz narrow beam.
When set to 200 kHz, only the returns from the 200 kHz narrow beam will
be displayed in the Sonar View. The Split Sonar View will continue to display
returns from both beams in their respective windows. The RTS® Window in
the Sonar View will display the returns from the 200 kHz narrow beam.
When set to 83 kHz, the returns from the 83 kHz wide beam will be
displayed in the Sonar View. The Split Sonar View will continue to display
returns from both beams in their respective windows. The RTS® Window will
display the returns from the 83 kHz wide beam.
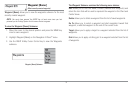
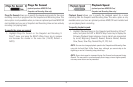
T
o use Beam Select:
1. Highlight Beam Select on the Sonar main menu.
2. Use the LEFT or RIGHT 4-WAY Cursor Control keys to select either
the 200 kHz beam, the 83 kHz beam or the 200/83 kHz beam.
(200/83 kHz, 200 kHz, 83 kHz, Default = 200 kHz)
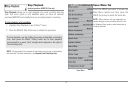
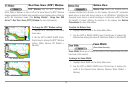
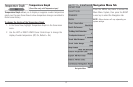
Fish ID+™
Fish ID+™ uses advanced signal processing
to interpret sonar returns, and will display a Fish Symbol when very selective
requirements are met. When a fish is detected, a fish icon and its depth are
displayed above the return that has been classified as being a fish. Three
different fish size icons represent the intensity of the sonar return, and
provide an indicator of relative fish size.
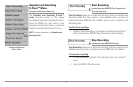
DualBeam PLUS™ sonar models represent targets detected in the 200 kHz
narrow beam as orange fish symbols, and represent targets detected in the
83 kHz wide beam as blue fish symbols.
When Fish ID+™ is turned off, the 900 Series™ shows only the raw sonar
returns on the display. These returns will often result in "arches" forming on
the display, indicating potential targets. Due to the transducer beam angle,
the distance to a fish decreases as the fish moves into the beam, and then
increases as it moves out again, creating a Fish Arch when this distance
change is shown on the display. Boat speed, chart speed, and the position
of the fish within the sonar beam greatly affect the shape of the arch.
200 kHz, narrow beam
orange fish symbols
83 kHz, wide beam blue fish symbols
80