


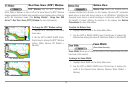
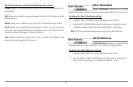
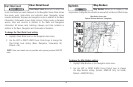

Temperature Graph
(Sonar View only, with Temperature input)
Temperature Graph allows you to display or suppress a water temperature
graph over the main Sonar View to show temperature changes correlated to
recent sonar history.
T
o change the display of the Temperature Graph:
1. In the Sonar View, highlight Temperature Graph on the Sonar main
menu.
2. Use the LEFT or RIGHT 4-WAY Cursor Control keys to change the
display of water temperature. (Off, On, Default = On)
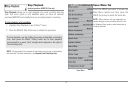
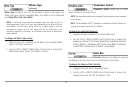
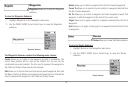
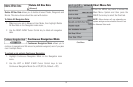
Navigation Menu Tab
Press the MENU key twice to access the
Main Menu System, then press the RIGHT
cursor key to select the Navigation tab.
NOTE: Menu choices will vary depending on
system settings.
Navigation Menu
87