


930-134-01-A.00 PowerLogic
TM
Series EM4000
11/2013 Installation Guide
©2013 Schneider Electric All Rights Reserved 27
Display Navigation
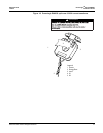
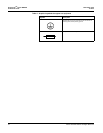
The PowerLogic EM4000 meter has three buttons to control the information
presented on the LCD. The display has a normal and a diagnostics mode. The
PowerLogic EM4000 meter starts in normal mode, and enters diagnostics mode
when the Display button is pressed and held for 5 seconds. To adjust the contrast,
hold down the Display button, and use the right and left arrow buttons to increase
and decrease the contrast respectively.
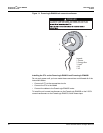
Normal Mode
In Normal mode, the Display button scrolls through the information for each meter.
The left and right arrow buttons select the previous or next meter points
respectively. The following information is available:
• Real Energy Delivered kWh D
• Real Energy Received kWh R
• Real Power Watts
• Reactive Energy Delivered kVarhD
• Reactive Energy Received kVarhR
• Reactive Power Var
• Peak Demand Peak W (Watts)
In Normal mode, the right and left arrow buttons scroll the display from meter points
1 to 8, 1 to 12, or 1 to 24, depending on your configuration.
Diagnostics Mode
Diagnostics mode is accessed by pressing and holding the Display button for 5
seconds. In Diagnostics mode, pressing the Display button will scroll through the
following additional information:
• Send data command
• CT Primary value and Real Power Watts per phase
• Current (Amps) per phase
• Power factor (pf) per phase
• Phase angle (degrees) per phase
• Voltage per phase
• Local IP address
• Reset factory default IP address command
•Verify
• Badge #
• Date and time (UTC)
In Diagnostics mode, the right and left arrow buttons scroll the display from meter 1
to 8, 1 to 12, or 1 to 24, depending on your configuration. When the local IP
address is shown on the LCD, use the right and left arrow buttons to scroll through
the following information:
• Remote host server IP address
• Time server IP address
• Default IP address
• Default NetMask