


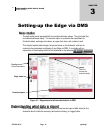
Understanding what data is stored
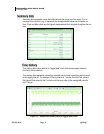
Summary data
053-644, Rev E Page 17 eg4 & eg3
17
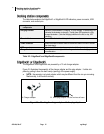
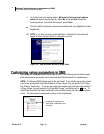
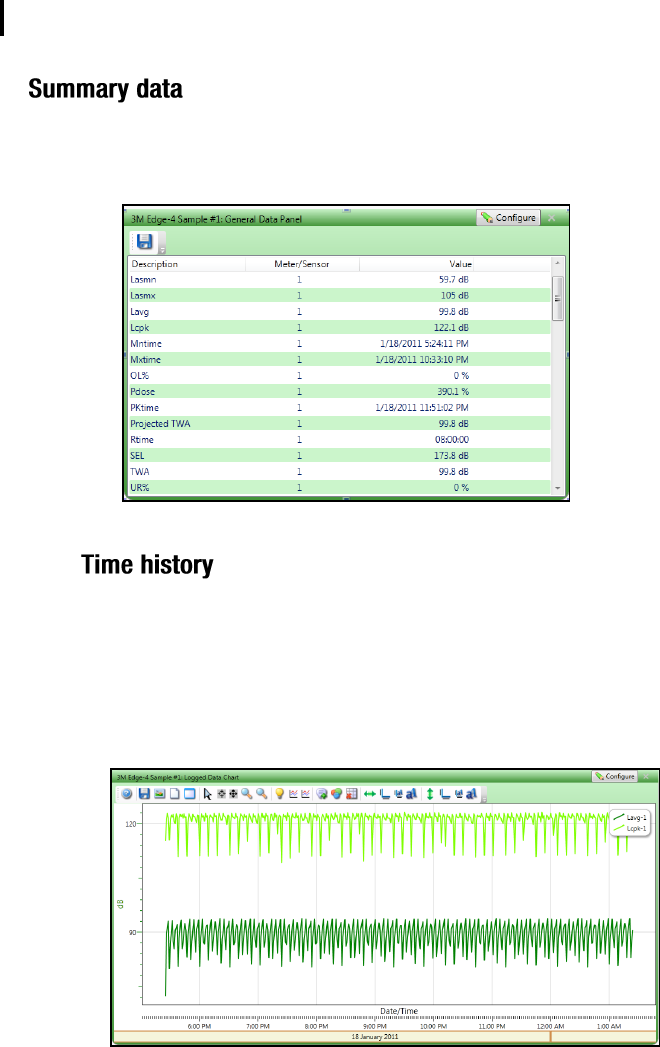
Summary data represents values that occurred over the entire run of the study. For an
average value, such as Lavg, it represents the average decibel value over the entire run
time. Peak and Max values are the highest measurements that occurred throughout the run
time.
Figure 3-2: Sample summary data from DMS reporting
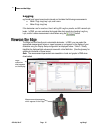
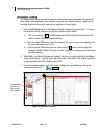
Time history data is also referred as “logged data” which plots measurement values in
minute by minute intervals.
Time History data represents values that occurred over the most recent time period, which
is the logging interval. For example, if the log interval is 1 minute, then the Peak value is
the highest Peak value for that 1 minute, and the Lavg value is the average dB value for
that 1 minute.
Figure 3-3: Sample time history data (or logged data) chart