


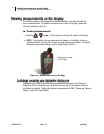
Viewing measurements on the display
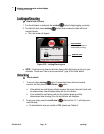
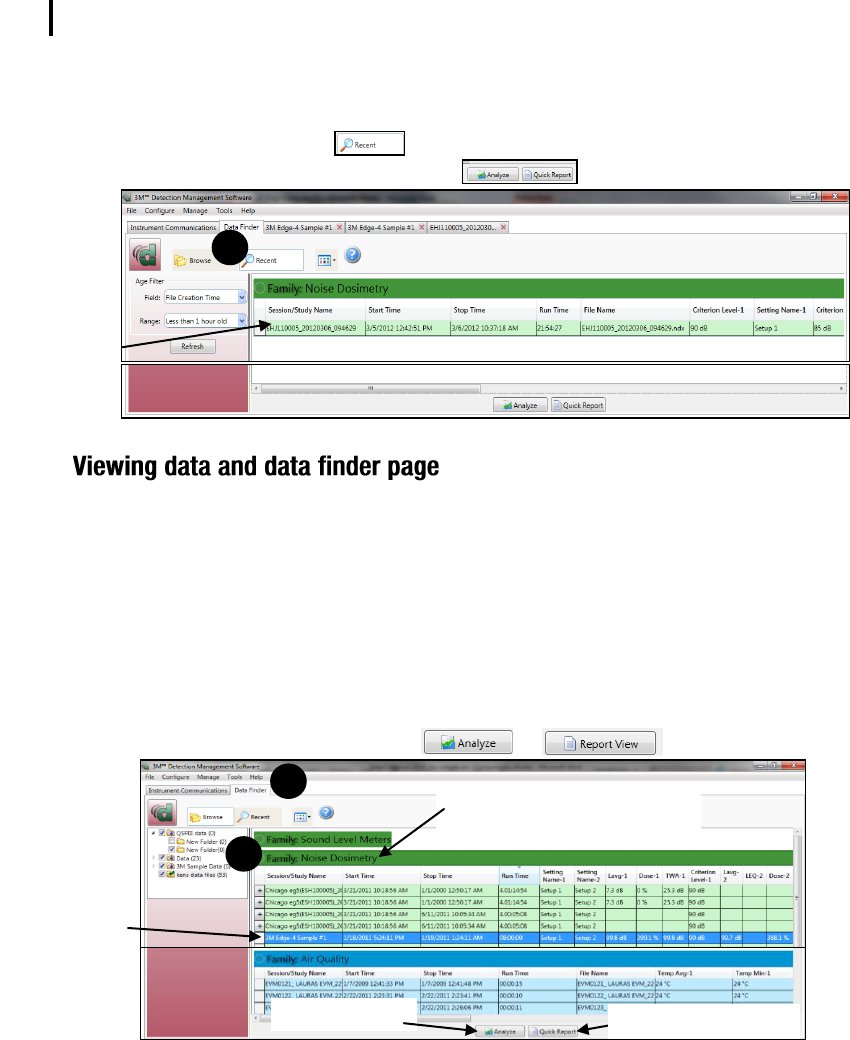
Viewing data and data finder page
053-644, Rev E Page 43 eg4 & eg3
43
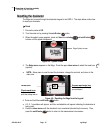
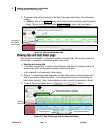
8. The sessions (files) will load and post to the Data Finder page under Family: Noise Dosimetry
heading.
Quick tip: click on the button and the data files will post directly under the specific
family. Click on the file and select either to view in charts and graphs.
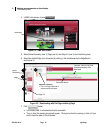
Figure 5-4: Recent downloaded data
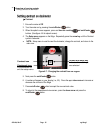
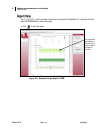
After the data is downloaded, it is stored and viewable in the data finder. With a quick double-click,
the information is viewable in customizable graphs and/or charts.
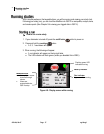
Selecting and viewing data
1. In the Data Find page (see 1), select the Noise Dosimetry data (see 2) by clicking on either the
session/study (Note: you may need to expand to see the study data.)
Once selected, it will appear with a blue shading.
2. Optional: To reorganize the data displayed in the data finder columns, click drag and drop the
titles of the columns in different positions. To shrink/expand the columns, click and drag the
black column divider(s). (Note: these methods are similar to positioning/expanding in Excel.)
3. To view in Graphs and Tables, click on or buttons.
Figure 5-5: Data Finder page with the downloaded data
Selected
Edge data
Analyze button
1
Quick Report button
Data headings (optional: drag, drop
and/or expand columns to view data)
2
Example of
data file in
recent view
1