


7. Vector Charts
7-52
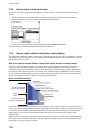
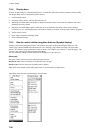
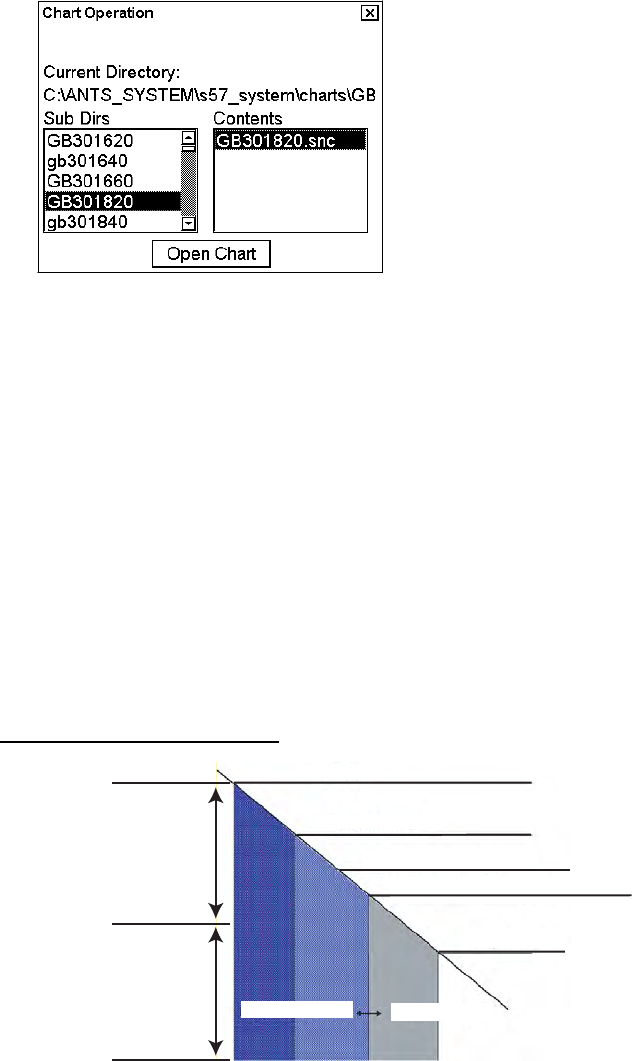
7.9.2 How to select a chart by its name
To activate a specific S57 chart cell onto the display, use Open Chart by Cell name menu in the Chart menu as
follows:
1. Spin the scrollwheel to display Menu/Info/Chart Menu in the guidance area then push the right button.
2. Choose Open Chart by Cell name from the menu then push the scrollwheel.
3. Choose desired chart from the chart list dialog box then click the Open Chart button.
The chosen chart is automatically displayed in the electronic chart area.
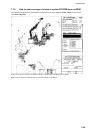
7.9.3 How to control visible chart features (chart display)
The Chart Display dialog box contains several pages of chart features that you may adjust as appropriate. To display
this dialog box, spin the scrollwheel to show Chart Display/Info/Standard Display in the mouse functions area and
then push the left mouse button.
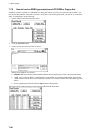
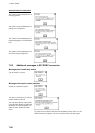
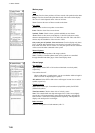
How to set value for Shallow Contour, Safety Depth, Safety Contour and Deep Contour
You can set values for Shallow Contour, Safety Depth, Safety Contour and Deep Contour. This can be done on
Chart page of the Chart Display dialog box. Colours used for depth presentation on the electronic chart are
controlled by setting values for Shallow Contour, Safety Depth, Safety Contour and Deep Contour. Soundings on
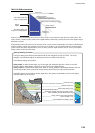
the electronic chart, which are equal to or less than the value of Safety Depth, are highlighted. See below pictures
for multi-colour presentation and two-colour presentation. Selection of multi- and two-colour presentations can be
done by selecting from list box of "Depths" on Chart page of Chart Display.
MULTI-COLOUR presentation
Chart zero
Shallow contour
Safety contour (input value)
Safety contour (exisiting in ENC)
Deep contour
Non-navigable area
Navigable area
Safety
depth
Soundings within this
range are highlighted.
Soundings within this
range are not highlighted.
In the multi-colour presentation four colours are used for depths. If input Safety contour does not exist in electronic
chart, system selects automatically next available deeper depth contour as Safety contour. For example input value is
8 m, but there is no 8 m depth contour in electronic chart, the system automatically selects next available deeper
depth contour (10 m) as Safety contour. Depth contour value of 10 m is presented as Safety Contour in this
electronic chart.
Shallow contour is for possible visual color change inside the unsafe water area. Unsafe water area is all shallower
than "safety contour". Set value of Shallow Contour less than value of Safety contour. For more information about
color change, see below selection of "Depths".