


10 GPSMAP
®
4000/5000 Series Owner’s Manual
Using Charts
Using
Charts
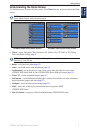
Understanding How Wind VMG and Waypoint VMG Are Displayed in the
Data Bars
The chartplotter automatically switches between displaying Wind Velocity Made Good (VMG) and
Waypoint VMG in the data bars.
Waypoint VMG is displayed under these conditions:
The Route Leg data bar displays Waypoint VMG when you are navigating a route or an
automatic guidance line.
The Sailing data bar displays Waypoint VMG when you are navigating a route or an automatic
guidance line, and you turn the Route Leg data bar off. For more information on conguring the
data bars, see page 9.
Wind VMG is displayed under these conditions:
The Sailing data bar displays Wind VMG when you are not navigating a route or an automatic
guidance line.
The Sailing data bar displays Wind VMG when the Route Leg data bar is on.
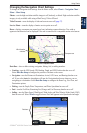
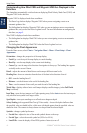
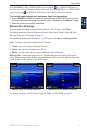
Changing the Chart Appearance
From the Home screen, select Charts > Navigation Chart > Menu > Chart Setup > Chart
Appearance.
Orientation—changes the perspective of the map display.
North Up—sets the top of the map display to a north heading.
Head Up—sets the map display to the current track heading.
Course Up—sets the map so the direction of navigation is always up. The heading line appears
vertically on the screen if shown.
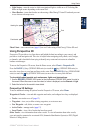
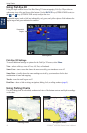
Detail—adjusts the amount of detail shown on the map at different zoom levels.
Heading Line—draws an extension from the bow of the boat in the direction of travel.
Off—turns the heading line off.
Distance—sets the distance to the end of the heading line.
Time
—sets the amount of time until you reach the end of the heading line.
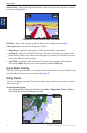
World Map—displays either a basic world map or displays satellite imagery (when Full World
Map is selected).
Inset Map—turns the inset map on or off when panning away. Select Auto to turn the inset map on
only when the boat symbol is no longer visible.
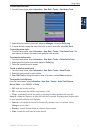
Spot Depths—turns spot soundings on or off and sets a dangerous depth.
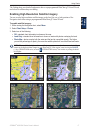
Safety Shading (with supported BlueChart g2 Vision cards)—Areas with depths shallower than
the specied value are shaded in blue, while areas with depths greater than the specied value are
shaded in white. The contour is always drawn at or deeper than the selected depth.
Symbols—changes symbol preferences.
Navaid Size—adjusts the size of the navaid symbols shown on the map.
Navaid Type
—selects the navaid symbol set (NOAA or IALA).
Land POIs—turns the display of land POIs (points of interest) on or off.
•
•
•
•
•
•
•
•
•
•
•
•
•