


40 GPSMAP
®
4000/5000 Series Owner’s Manual
Using Sonar
USinG
Sonar
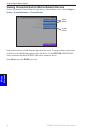
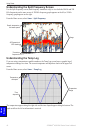
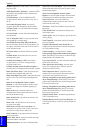
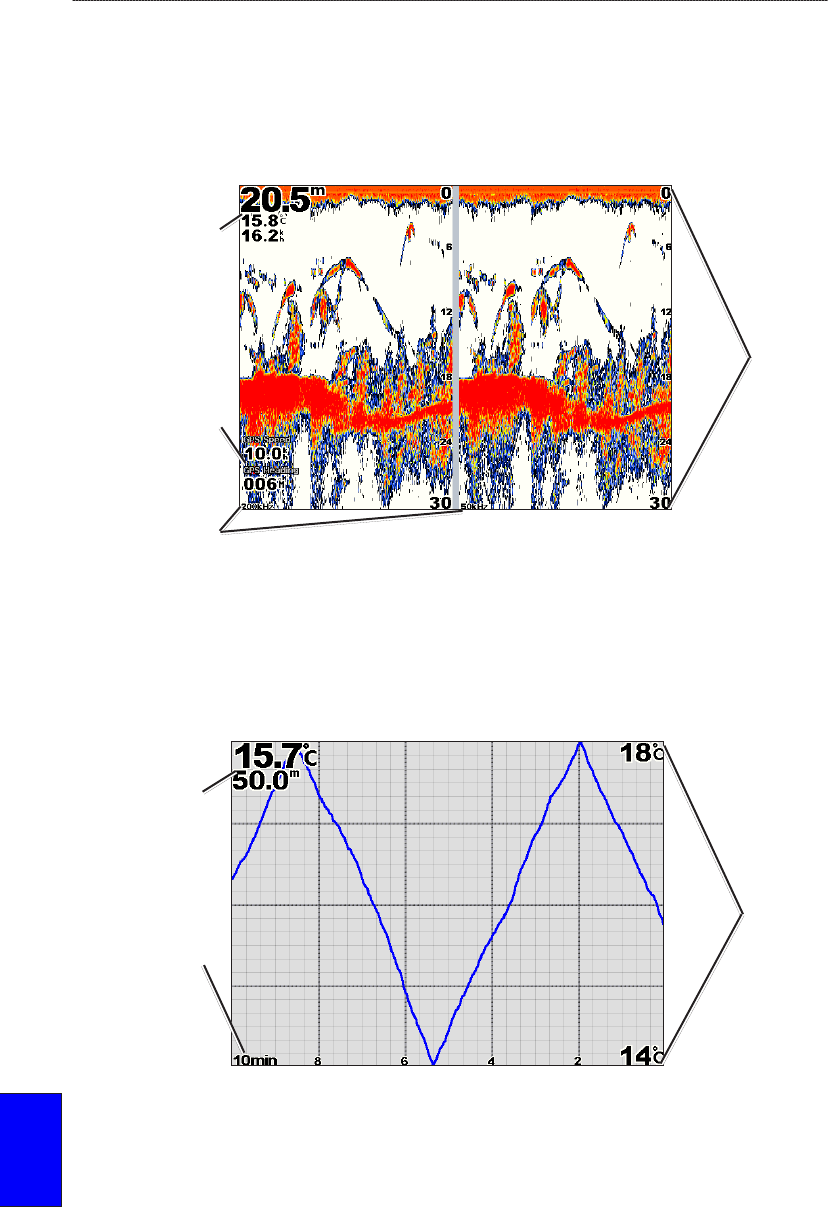
Understanding the Split Frequency Screen
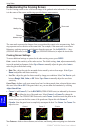
Use the Split Frequency screen (dual-frequency transducer only) to view both the 50 kHz and 200
kHz frequencies on the same screen. A 200 kHz frequency graph appears on the left; a 50 kHz
frequency graph appears on the right.
From the Home screen, select Sonar > Split Frequency.
Depth, temperature,
and water speed
GPS speed and
GPS heading
Transducer
frequencies
Range
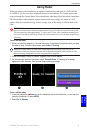
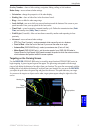
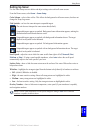
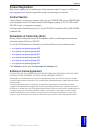
Understanding the Temp Log
If you are using a temperature-capable transducer, the Temp Log screen keeps a graphic log of
temperature readings over time. The current temperature and depth are shown in the upper-left
corner.
From the Home screen, select Sonar > Temp Log.
Temperature
and depth
Time
elapsed
Temperature
Range
The temperature appears along the right side and the time elapsed appears along the bottom. The
graph scrolls to the left as information is received.