


Page 64 CPV350
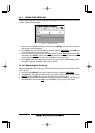
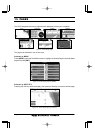
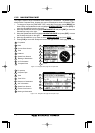
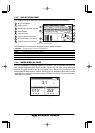
13.0.6 Land Settings
To control the display on the map of the terrestrial features.
Land Elevation Values : The Land Elevation areas are always shown, but it is possible to turn the displaying of Land
Elevation On or Off.
Roads : Turns the displaying of roads On or Off.
Points of interest : Turns the displaying of Points of Information On or Off.
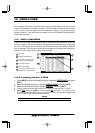
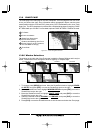
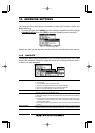
13.0.7 Chart Settings
Settings that control how the chart features will be shown on the Chart page of the GPS
chartplotter.
Lat/Lon Grid : Turns the displaying of the Latitude and Longitude grid lines on or off on the chart page.
Chart Boundaries : Turns the displaying of Chart Boundaries on, off or auto mode which shows the chart boundaries
of the two charts below the current scale. The chart boundaries are only show when a C-Map NT,
NT
+
or MAX card is inserted into the GPS chartplotter.
Value Added Data : Turns the displaying of Value added data On or Off. The Value Added Data (VAD) is a collection
of additional cartographic objects which are not present on the original paper chart (from which
the electronic chart derives). These objects have been obtained from other sources (that C-MAP
believes to be reliable) and then merged to the electronic charts in order to provide more
information useful for the navigation. VAD object can be any cartographic objects and it can be
distinguished from the official-chart-objects from the Quick Info. A dedicated icon is shown on the
Quick Info window to indicate that the object queried is a VAD. The same icon is also shown on
the Full Info page and in addition the extended text Value Added Data is shown on the details of
the VAD object.
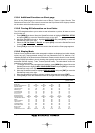
Mixing Levels : When the map coverage at the current chart scale does not fill the entire display, the GPS
chartplotter draws the rest of the map using charts from above and below the current scale. When
this function is turned on you will notice the display may redraw 2 to 3 times to show all the details.
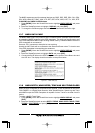
Chart Lock (*) : Sets On/Off the Chart Lock option. When Chart Lock is On, the available zoom scales are only
the ones containing cartographic data. Instead when Chart Lock is Off, it is possible to zoom down
into zoom scales not covered by cartographic data after the last available zoom scale covered by
cartographic data. The DSI window, if present, will show “NO CHART”, when an empty level is
entered in the location of map expansion mode.
NOTE(*)
When an empty level is entered, the message “No cartographic coverage” is shown on a window
in a corner of the map display. The warning message is always displayed as long as the current
zoom has no data coverage.
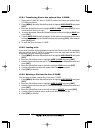
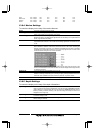
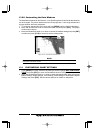
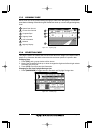
13.0.8 Underwater Objects Settings
To control the display on the map of the Underwater Objects features.
Underwater Objects Limit: Selects the max depth value to display Underwater Objects. If value is set to 0 Mt, the
Underwater Objects are not shown on the charts. Menu options are grayed out. If value
is more than 0 Mt (i.e. 10 Mt), in the Range from 0 Mt to the selected value the Underwater
Objects are displayed according to their setting below. The default setting is 10 Mt.
Rocks : Sets Off/Icon/Icon+Depth* the displaying of the Rocks. The default setting is Icon.
Obstructions : Sets Off/Icon/Icon+Depth* the displaying of the Obstructions. The default setting is Icon.
Diffusers : Sets Off/Icon/Icon+Depth* the displaying of Diffusers. The default setting is Icon.
Wrecks : Sets Off/Icon/Icon+Depth* the displaying of Wrecks. The default setting is Icon..
NOTE(*)
Choose the options: OFF (the object is not visible independently of the selected “Underwater Object
Depth Value”); ICON (the object icon is visible without tags, in the range selected from “Underwater
Object Depth Value” option); ICON+DEPTH (the object icon and tag is visible, in the range selected
from “Underwater Object Depth Value” option).