


2 –5b
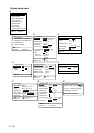
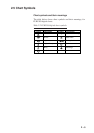
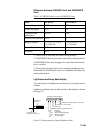
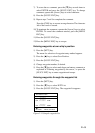
Difference between FURUNO chart and NAVIONICS
chart
Table 2-4 FURUNO chart versus NAVIONICS chart
*1 NAVIONICS chart may not center cursor perfectly.
*2 NAVIONICS chart may not center own ship's position perfectly.
A NAVIONICS chart may disappear for some time when the dis-
play is scrolled.
*3 Using newly designed chart cards containing lighthouse data.
Chart cards for North America area are completed, and others are
under production in.
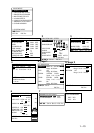
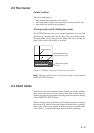
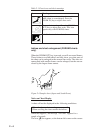
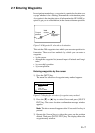
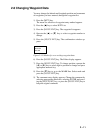
Lighthouse and buoy data display
You can find data of lighthouses and buoys by placing the cursor
on them.
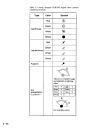
Lighthouse and buoy data are abbreviated on the display as shown
in Figure 2-5.
Figure 2-5 Interpretation of buoy/lighthouse data
Item FURUNO NAVIONICS
Dot scrolling capability YES YES
Course-up display YES NO
Lighthouse data
presentation
YES *3 YES
Zoom at cursor position YES *1
Range at Equator 1, 1.5, 2, 3, 4, 5, 6, 8,
12...8192 nm
0.125, 0.25, 0.5, 1, 2, 3,
4, 8...1024 nm
Chart offset data entry YES NO
Centering YES *2
FL 12S 27M
Place the cursor on
a lighthouse or buoy mark.
Lighthouse or
buoy data
FL(2) G 12S 15M
Number of flashes perperiod (ex.:2)
Period(ex.: 12 seconds)
Visibility in nautical miles(ex.: 15 miles)
FL : Flashing
F : Fixed light
F FL : Fixed and Flashing light
MO : Morse code light
Oc : Occulting light
Light color
Example of data displayed