


11
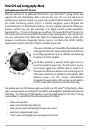
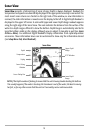
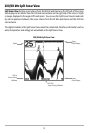
Understanding Sonar History
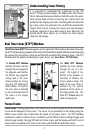
It is important to understand the significance of the 700
Series™ Fishing System display. The display does NOT show a
literal 3-dimensional representation of what is under the water.
Each vertical band of data received by the control head and
plotted on the display represents something that was detected
by a sonar return at a particular time. As both the boat and the
targets (fish) may be moving, the returns are only showing a
particular segment of time when objects were detected, not
exactly where those objects are in relation to other objects
shown on the display.
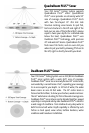
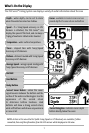
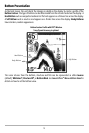
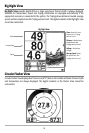
Real Time Sonar (RTS®) Window
A Real Time Sonar (RTS®) Window appears on the right side of the display in the Sonar View only.
The RTS® Window always updates at the fastest rate possible for depth conditions and shows only
the returns from the bottom, structure and fish that are within the transducer beam. The RTS®
Window plots the depth and intensity of a sonar return (see Sonar Menu - RTS® Window).
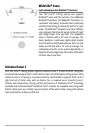
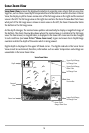
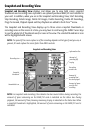
Freeze Frame
Freeze Frame - Pressing any arrow on the 4-WAY Cursor Control key will freeze the screen and a
cursor will be displayed on the screen. The cursor can be positioned on the display using the
4-WAY Cursor Control key to determine the depth of any sonar return. The RTS® Window
continues to update in Freeze Frame. In addition, see the effects of menu setting changes with
Instant Image Update. Pressing EXIT will exit Freeze Frame and the display will start to scroll.
Freeze Frame is available in the Sonar, Sonar Zoom, and 200/83 kHz Split Sonar Views.
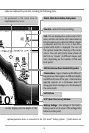
The Narrow RTS® Window
indicates the sonar intensity
through the use of grayscale.
The grayscale used matches
the bottom view grayscale
setting used in the sonar
history window (i.e. Inverse,
Structure ID®, WhiteLine®,
Bottom Black). The depth of
the sonar return is indicated
by the vertical placement of
the return on the display
depth scale.
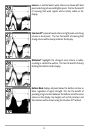
The Wide RTS® Window
indicates the sonar intensity
through the use of a bar
graph. The length of the
plotted return provides an
indication of whether the
return is weak or strong. The
depth of the sonar return is
indicated by the vertical
placement of the return on
the display depth scale. The
Wide RTS® Window does not
make use of grayscale.