149
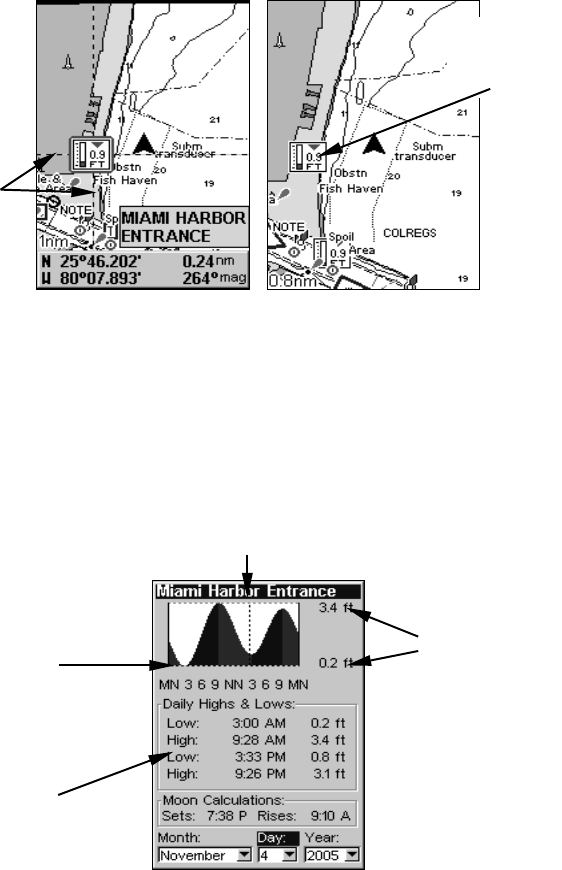
NauticPath chart showing Tide Station icon selected by cursor (left).
Icon animates automatically without selection at the 0.8-mile zoom
range (right). In the example above, the tide is at 0.9 feet and falling,
as shown by the down arrow at the top of the icon.
To view tide information:
1. Use the arrow keys to move the cursor over a tide station icon. When
it is selected, a pop-up name box appears.
2. Press
WPT to display the Tide Information screen.
Tide Information screen.
The Tide Information screen displays daily tidal data for this station on
this date at the present time. The graph at the top of the screen is an
approximate view of the tidal range pattern for the day, from midnight
(MN) to noon (NN) to midnight (MN). The dotted line across the graph
is the Mean Lower Low Water line (MLLW).
Tide Station
icon in ani-
mated mode
Cursor
lines
Height
Scale
MLLW
Line
Tide
Table
Current Time Line


