


12 SETTING ATMOSPHERIC CORRECTION
12-3
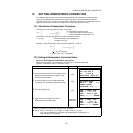
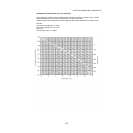
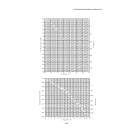
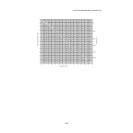
Atmospheric Correction Chart (For your reference)
The atmospheric correction value is obtained easily with the atmospheric correction chart. Find the
measured temperature in horizontal, and pressure in vertical on the chart.
Read the value from the diagonal line, which represents the required atmospheric correction value.
Example:
The measured temperature is +26°C
The measured pressure is 1013 hPa
There fore,
The correction value is +10ppm