


8. HOW TO CONTROL CHART OBJECTS
8-3
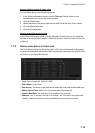
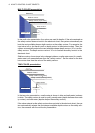
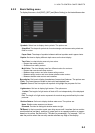
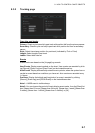
8.2.2 Basic Setting menu
To display this menu, click [DISP], [SET] and [Basic Setting] on the InstantAccess bar.
Boundaries: Set how to display boundaries of some chart features. The options are:
Plain: The line styles are limited to plain solid and dashed lines.
Symbol: Some of the line styles use symbols to highlight the purpose of a line.
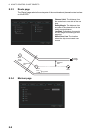
TM Reset: In the true motion mode, own ship moves until it reaches the true motion
reset borderline (set here), and then it jumps back to an opposite position on screen
based on its course. Set the limit for TM reset (in percentage). For example, "100" re-
sets the position when the own ship marker reaches any edge of the display.
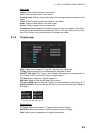
Symbols: Select how to display chart symbols. The options are
Simplified: The shape of symbols is of modern design and the sea mark symbols are
filled in a color.
Paper Chart: The shape of symbols imitates traditional symbols used in paper charts.
Depths: Set how to display different depth zones on the chart display.
Two Color: he chart display uses only two colors:
• Deeper than safety contour
• Shallower than safety contour
Multi Color: The chart display uses four different colors for contours:
• Deeper than user-chosen deep contour
• Between deep contour and user-chosen safety contour
• Between safety contour and user-chosen shallow water contour
• Between shallow water contour and coastline.
Lightsectors: Set how to display light sectors. The options are
Limited: The length of a light sector is fixed at 25 mm independently of the displayed
scale.
Full: The length of a light sector represents its nominal range as defined by the chart
producer.
Shallow Pattern: Set how to display shallow water area. The options are:
None: Shallow water areas are not shown.
Diamond: Provided to distinguish shallow water at night.