


Page 46 GPS Chart Plotters
♦ O. Zoom: red when the chart is over-zoomed in more than twice normal scale,
gray otherwise.
♦ Chart Lock: red when the chart is zoomed in more than twice normal scale,
gray otherwise.
NOTE
U. Zoom, O. Zoom and chart lock are used with Flexi zoom selected.
Best Map
Red when a more detailed chart is available under the cursor position.
Data Off
Red when at least one of the following objects or layers is turned off (by the user):
Depths/soundings; Wrecks/obstructions; Tracks/routes; Attention Areas; Nav-Aids.
Declutter
Displays red when clearing overlapping objects.
Dangers
Red when “Guardian Technology” detects one of the following objects: Land, Inter-
tidal, Depth Area, Rocks, Obstructions, Shoreline Constructions, Fishing Facility,
Wrecks, Dragged area, Diffusion area, Mooring facilities, Pingos and Production in-
stallations.
Caution
Red when “Guardian Technology” detects cautionary or restricted area.
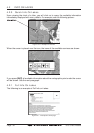
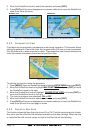
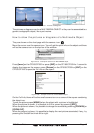
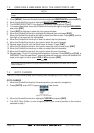
6.0.5 Currents Prediction
It is possible to see the variation of the Tidal arrows on the selected area at any given time.
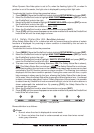
To activate this function follow the procedure:
1. Press [MENU]. Move the ShuttlePoint knob to highlight
SETUP MENU and press [ENT].
2. Move the ShuttlePoint knob to highlight
MAX FUNCTIONS and press [ENT] or move
the ShuttlePoint knob to the right.
3. Move the ShuttlePoint knob to highlight
CURRENTS PREDICTION and press [ENT] or
move the ShuttlePoint knob to the right.
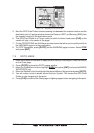
4. A window is shown on the low-left side of the chart. On the CP300/CP300i, press [S
ET T IME]
to set the date and time manually, and [I
NCR. TIME]/[DECR. TIME] to decrease/increase time;
press [E
XIT] to exit. On the CP180/CP180i press [ENT] to set the date and time manually,
and [GOTO]/[MENU] to decrease/increase time; press [CLR] to exit.
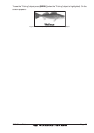
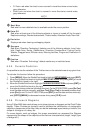
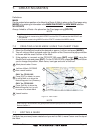
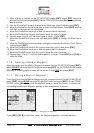
6.0.6 Pictures & Diagrams
Using C-Map MAX data cards allows you to show pictures or diagrams on the Chart Plotter
display. These Pictures are typically used to facilitate the identification of cartographic
objects or places around the map: they can be the landscape layout nearby a harbour, the
shape of a bridge or of a buoy etc.
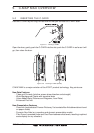
On some objects, such as bridges, the image associated can represent the Diagram
representing the shape of the objects and the various characteristics (length, height, type
of bridge etc.).