


Page 64 CP500
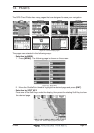
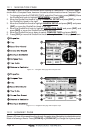
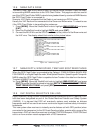
12.0.3.0 MARINE Settings
To control the display on the map of the marine features.
Place Names : Turns the Local area names On or Off.
Names Tags : Turns On or Off a tag for particular chart objects that either includes the Name of the chart
object or the Depth of an Underwater chart object.
Nav Aids & Light Sectors: Turns the presentation of Lights, Signals, Buoys and Beacons On (Nav-Aids & Light
Sectors are shown), Off (Nav-Aids & Light Sectors are not shown) or No Sector (Nav-Aids
are shown, Light Sectors are hidden).
Attention Areas : Turns the displaying of Attention Areas (areas in which special attention by the mariner is
required because of natural or man-made hazards sailing regulations and restrictions) On or Off.
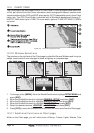
Tides & Currents : Turns the displaying of Tides and Currents On or Off.
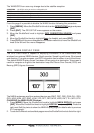
When data/time is available, Tidal stream arrows are shown on the charts, indicating the
direction and strength of the Tide. If no data/time is available from the GPS or the GPS
Chart Plotter is not in Simulation mode, the icon on the map is generic one. The color of
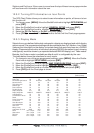
the arrow denotes the strength of the current as follows:
0 to 0.1 kn -
0.2 to 1.0 kn -
1.1 to 2.0 kn -
2.1 to 3.0 kn -
3.1 to 9.9 kn -
Yellow
Yellow
Orange
Orange
Red
When the GPS Chart Plotter receives a valid position fix, the Tide icons are shown on
the charts on the basis of the current date and time: the screen displays and changes
arrows as date/time changes.
Seabed Type : Turns the displaying of the Seabed type On or Off.
Ports & Services : Turns the displaying of Ports and Service icons On of Off. Areas along the shore with
facilities for mooring, downloading and uploading of ships, generally sheltered from waves
and winds. Port installations are piers, wharves, pontoons, dry docks, cranes....
Tracks & Routes : Turns displaying of underwater objects On or Off. Objects are obstructions, wrecks, cable etc.
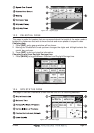
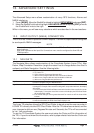
12.0.3.1 DEPTH Settings
To control the display on the map of the depth informations.
Depth Range Min : Sets the minimum depth limit to show Depth Sounding, Bathymetric Lines and Depth Area.
Depth Range Max : Sets the max depth limit to show Depth Sounding, Bathymetric Lines and Depth Area.
12.0.3.2 LAND Settings
To control the display on the map of the terrestrial features.
Land Elevations : Turns the displaying of Land Elevations On or Off.
Land Elevation Values : Turns the displaying of Land Elevation Values On or Off.
Roads : Turns the displaying to roads On or Off.
Points of interest : Turns the displaying of Points of Information On or Off.
12.0.3.3 CHART Settings
Settings that control how the chart features will be shown on the Chart page of the GPS
Chart Plotter.
Lat/Lon Grid : Turns the displaying of the Latitude and Longitude grid lines on or off on the chart page.
Chart Boundaries : Turns the displaying of Chart Boundaries on, off or auto mode which shows the chart
boundaries of the two charts below the current scale. The chart boundaries are only show
when a C-MAP NT, NT
+
or MAX card is inserted into the GPS Chart Plotter.
Value Added Data : Turns the displaying of Value added data On or Off. The Value Added Data (VAD) is a
collection of additional cartographic objects which are not present on the original paper chart
(from which the electronic chart derives). These objects have been obtained from other
sources (that C-MAP believes to be reliable) and then merged to the electronic charts in
order to provide more information useful for the navigation. VAD object can be any
cartographic objects and it can be distinguished from the official-chart-objects from the
Quick Info. A dedicated icon is shown on the Quick Info window to indicate that the object
queried is a VAD. The same icon is also shown on the Full Info page and in addition the
extended text Value Added Data is shown on the details of the VAD object.