


35
Sonar
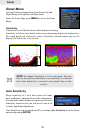
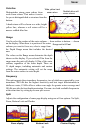
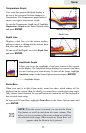
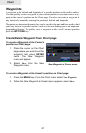
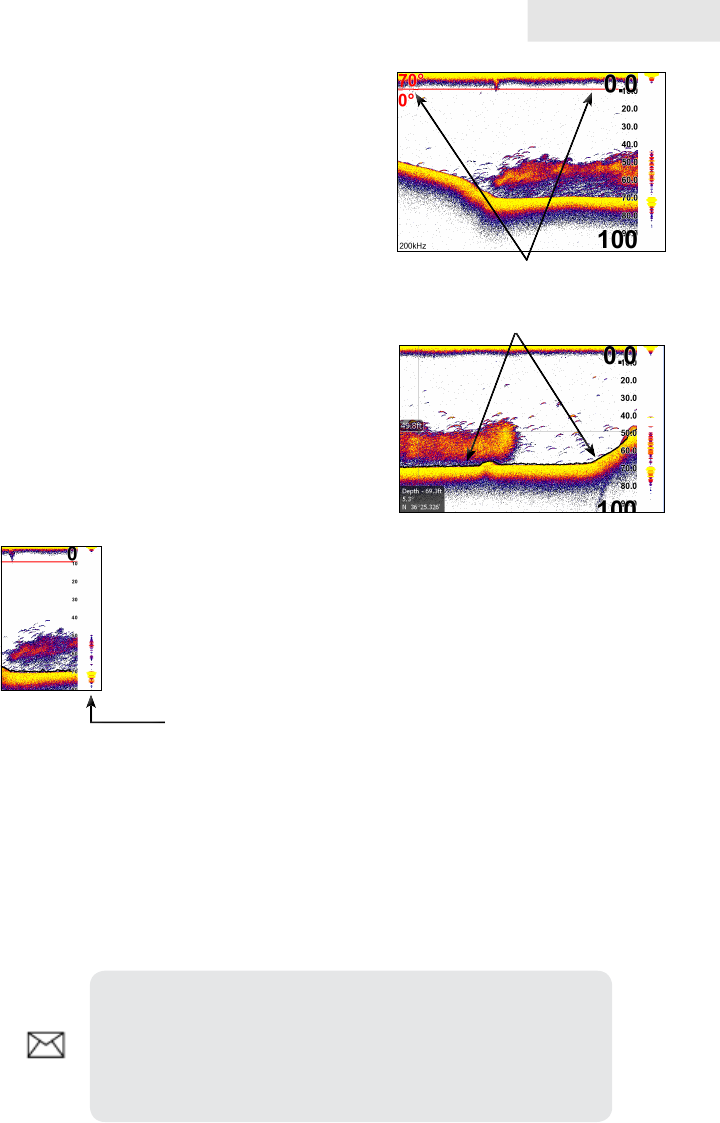
Temperature Graph
Uses a red line graph with digital display at
the top of the screen to illustrate changes in
Temperature. The Temperature graph makes it
easier to recognize temperature trends.
To turn the Temperature Graph on/off, highlight
Temperature Graph on the Sonar Options menu
and press ENTER.
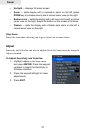
Depth Line
Displays a dark line over the bottom surface,
making it easier to distinguish the bottom from
sh, trees and other objects.
To turn on/off the Depth Line, select Depth Line
and press ENTER.
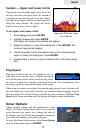
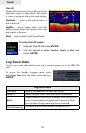
Amplitude Scope
Allows you to see the amplitude of real-time echoes as they appear
on the display. The Amplitude Scope displays live returns even when
you are viewing your sonar history. To turn off the Scope, highlight
Amplitude scope on the Sonar Options menu and press ENTER.
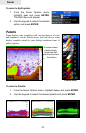
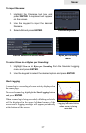
Zoom Bars
When your unit is in Split Zoom mode, zoom bars show which echoes will be
displayed on the screen when the display is zoomed in to a particular zoom range.
Only echoes shown between the top and bottom of a zoom bar will be displayed at
that selected zoom range.
To turn on/off Zoom Bars, highlight Zoom Bars on the Sonar Options menu and
press ENTER.
Temperature graph
Depth Line
Amplitude Scope
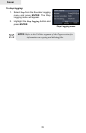
NOTE: When the screen is zoomed, you can use the Zoom
Pan feature to scroll up and down the water column. That
allows you to see portions of the water column not visible at
the selected zoom range. When turned on, Zoom Bars will
appear when the Zoom in key is pressed.