


15
INSIGHT
A
S
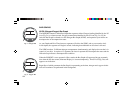
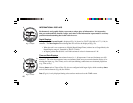
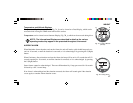
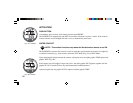
Ascent Rate Bar Graph (ASC)
The ASC (Fig. 4a) provides a visual representation of Ascent speed (i.e., an ascent speedometer), 'nor-
mal' rate, a 'cautionary' rate, and 'Too Fast'. The segments of the ASC represent 2 sets of speeds
which change at a reference depth of 60 FT (18 M). Refer to the chart at the right for segment values.
WARNING: At depths greater than 60 FT (18 M), Ascent Rates should not
exceed 60 FPM (18 MPM). At depths of 60 FT (18 M) and shallower, Ascent
Rates should not exceed 30 FPM (9 MPM).
Fig. 4 - ASC
a
Ascent Bar Graph
=> 60 FT (18 M)
Segments Ascent Rate =
Displayed FPM MPM
0 0 - 20 0 - 6
1 21 - 50 6.5 - 15
2 51 - 60 15.5 - 18
3 > 60 > 18
< 60 FT (18 M)
Segments Ascent Rate =
Displayed FPM MPM
0 0 - 10 0 - 3
1 11 - 25 3.5 - 7.5
2 26 - 30 8 - 9
3> 30> 9