PowerLogic™ PM5100 series user guide Chapter 5—Viewing Meter Data
© 2014 Schneider Electric All Rights Reserved
Chapter 5—Viewing Meter Data
You can view meter data from the meter’s front panel display, a web browser, or
through software.
Viewing meter data from the front panel
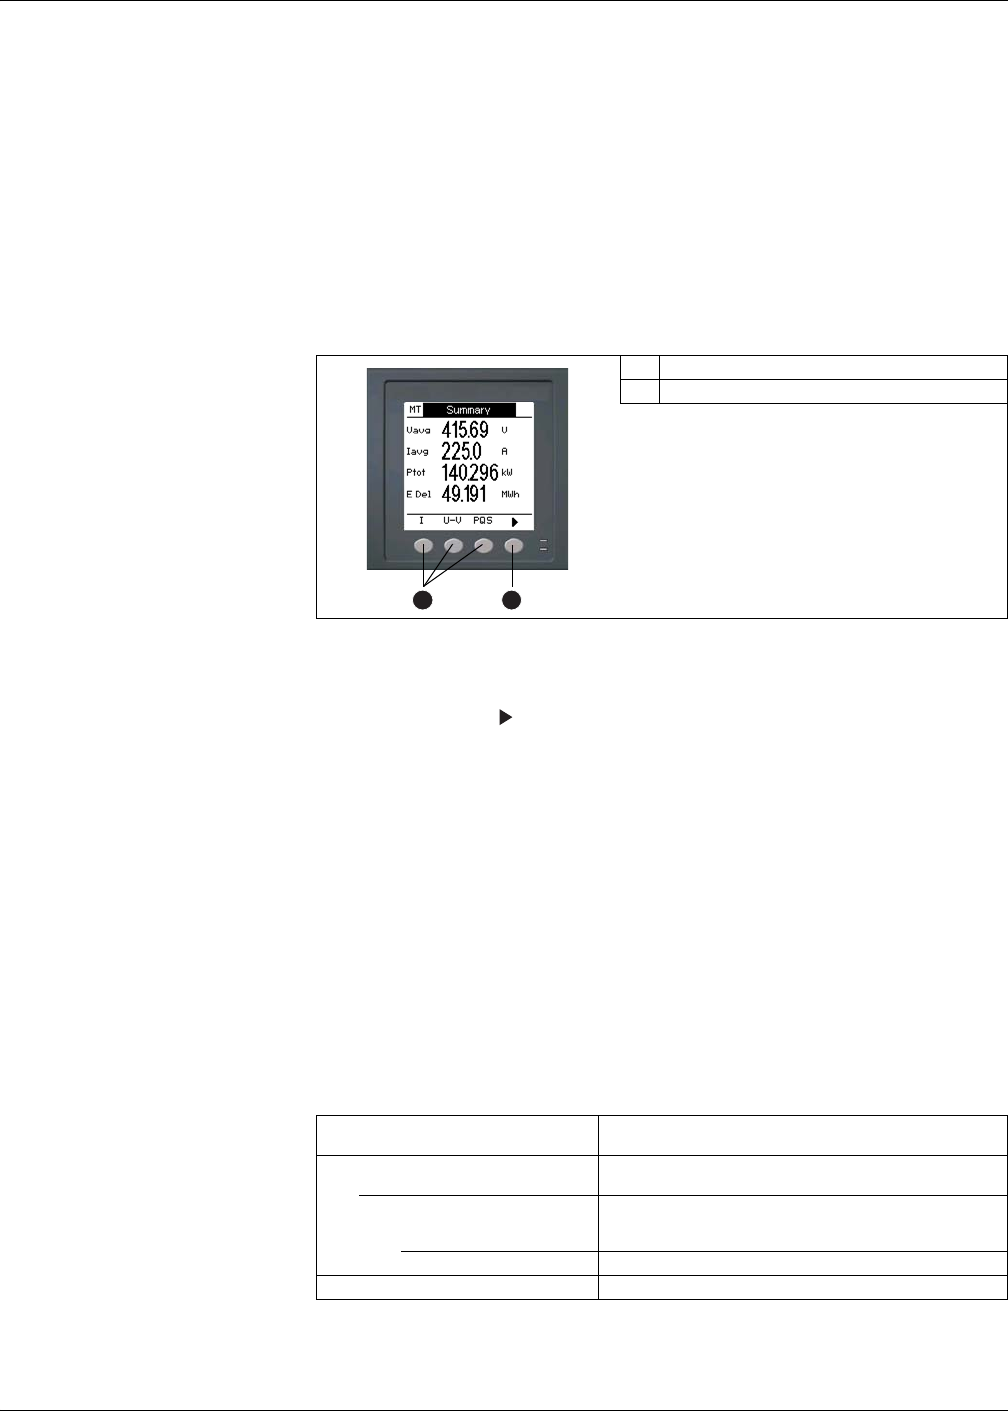
The Summary screen displays real-time values for average voltage and current (Vavg,
Iavg), total power (Ptot) and energy consumption (E Del).
Displaying data screens
To display data screens, press the button below the appropriate menu. To see more
menu items, press the navigation button.
Related topics
• See “Front panel display and meter setup” on page 29 for information on front panel
menu navigation.
Meter data display screens
The screen menu items are listed below. The titles listed are for the HMI mode in IEEE,
with the corresponding titles in IEC mode in square brackets [ ].
Related topics
• See “Setting up regional settings” on page 35 for details on changing the HMI
mode.
Summary screen
A Menu selection buttons
B Scroll right navigation button
Amps [I]
Phase
Instantaneous current measurements for each phase and
neutral.
Dmd
Summary of peak current demand values at the last demand
interval for each phase and neutral.
IAvg, Ia [I1], Ib [I2], Ic [I3], In, Ig
Real-time demand (Pres), peak demand (Peak) and predicted
demand (Pred) for the present interval. Average demand for the
previous interval (Last).
Pk DT Date and timestamp for the peak demand readings.
Ig Average (Iavg), neutral (In) and residual/ground (Ig) current


