


44 © 2014 Schneider Electric All Rights Reserved
Chapter 5—Viewing Meter Data PowerLogic™ PM5100 series user guide
Related topics
• See “Current demand” on page 65.
Related topics
• See “Power quality” on page 67.
Related topics
• See “Demand” on page 63.
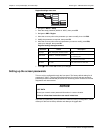
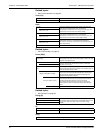
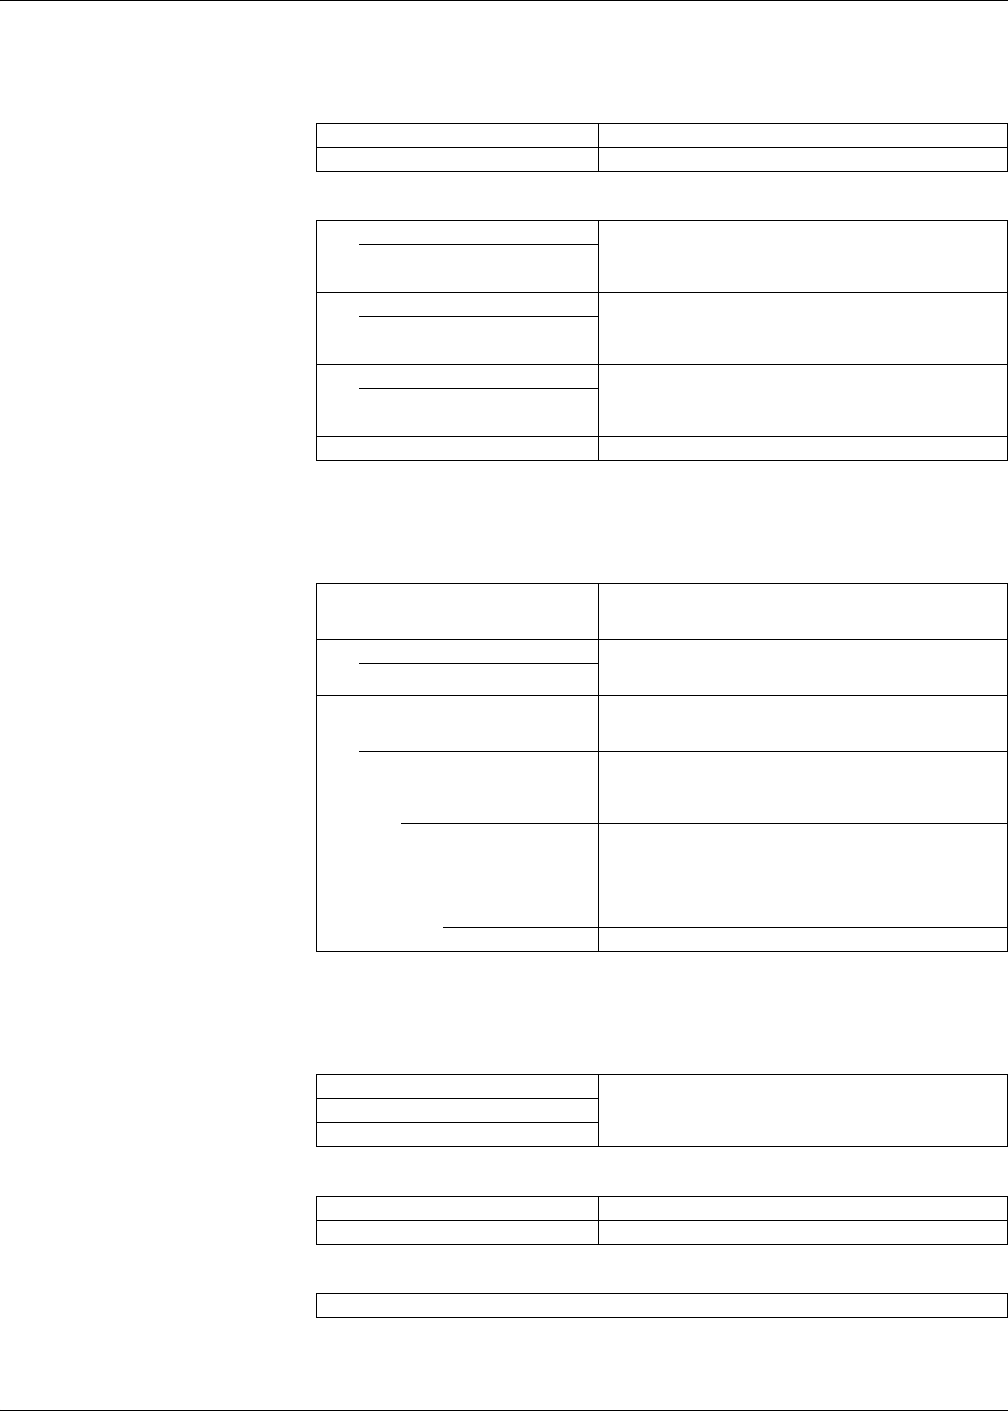
Volts [U-V]
V L-L [U] Line-to-line voltage for each phase.
V L-N [V] Line-to-neutral voltage for each phase.
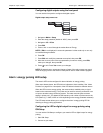
Harm
V L-L [U] Line-to-line voltage harmonics data: Numeric magnitude and
angle for the fundamental harmonic, and graphical
representation of harmonics for the 3rd to 11th and 7th to 15th
odd harmonics for each line-to-line phase voltage.
Fund, 3-11, 7-15
V L-N [V] Line-to-neutral voltage harmonics data: Numeric magnitude and
angle for the fundamental harmonic, and graphical
representation of harmonics for the 3rd to 11th and 7th to 15th
odd harmonics for each line-to-neutral phase voltage.
Fund, 3-11, 7-15
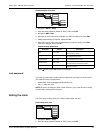
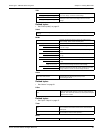
Amps [I] Current harmonics data: Numeric magnitude and angle for the
fundamental harmonics, and graphical representation of
harmonics for the 3rd to 11th and 7th to 15th odd harmonics for
each phase current.
Fund, 3-11, 7-15
TDD Total demand distortion for each phase voltage.
Power [PQS]
Power [PQS]
Summary of real-time power consumption values for total active
power [Ptot] in kW, total reactive power [Qtot] in kVAR, and total
apparent power [Stot] in kVA.
Phase Per phase (A [P1], B [P2], C [P3]) and total (Total [Ptot]) power
values for active power in kW, reactive power in kVAR and
apparent power in kVA.
Active [P], Reac [Q], Appr [S]
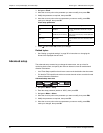
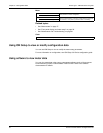
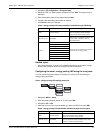
Dmd
Summary of peak power demand values in the previous (Last)
demand interval period for active power in kW, reactive power in
kVAR and apparent power in kVA.
Wd [Pd], VARd [Qd], VAd [Sd]
Total and per phase (A [1], B [2], C [3]) peak power demand
values in the previous (Last) demand interval for active power
demand (Wd [P]), reactive power demand (VARd [Q]) and
apparent power demand (VAd [S]).
Tot, A [P1], B [P2], C [P3]
Each of these sub-screens (total and per phase demand) display
power demand values for the current (Pres) demand interval,
predicted (Pred) demand based on the current power
consumption rate, demand for the previous (Last) demand
interval period, and the recorded peak (Peak) power demand
value.
Pk DT Date and timestamp for the peak (Peak) power demand value.
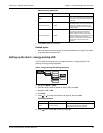
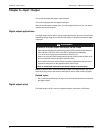
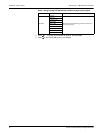
Energy [E]
Wh Delivered (Del), received (Rec), delivered minus received (D+R)
and delivered minus received (D-R) accumulated values for real
energy (Wh), apparent energy (VAh) and reactive energy
(VARh).
VAh
VARh
PF
True Per phase and total true power factor values and sign.
Disp Per phase and total displacement power factor values and sign.
Hz [F]
Frequency (Freq), average voltage and current (Vavg, Iavg) and power factor (PF) values.