


© 2011 Schneider Electric. All Rights Reserved.
PowerLogic
TM
Series 800 Power Meter 63230-500-225A2
Appendix D—Advanced Power Quality Evaluations 3/2011
94
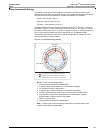
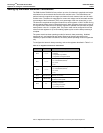
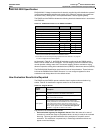
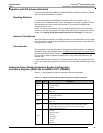
Figure D–1: ITI (CBEMA) Curve
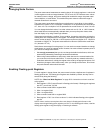
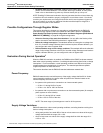
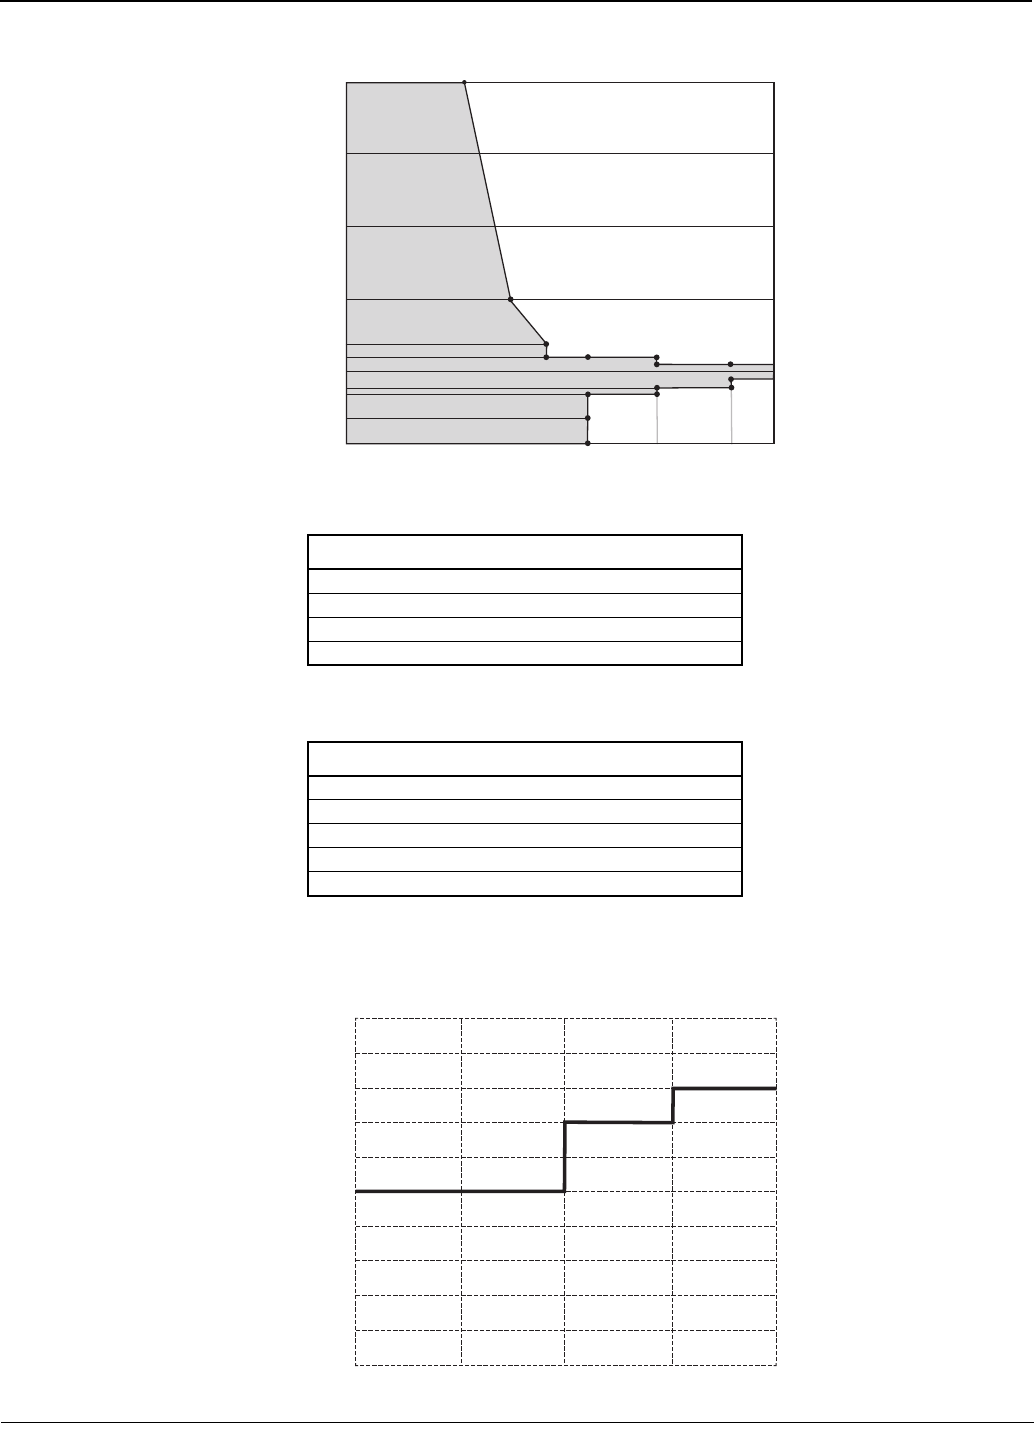
Figure D–2: Voltage Sag ride-through capability
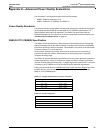
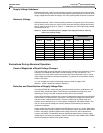
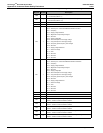
Table D–3: Categorized disturbance levels (F-47)
Sag levels
80% — 90%
70% — 80%
50% — 70%
0% — 50%
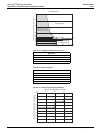
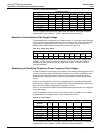
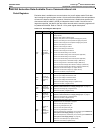
Table D–4: Duration categories
Duration
< 50 msec
50 msec — 200 msec
200 msec — 500 msec
500 msec — 1000 msec
>1000 msec
500
400
300
200
100
140
120
80
70
40
0
110
90
10 s
0.5 s
20 ms
No Damage Region
Prohibited Region
No Interruption In Function Region
Voltage Tolerance Envelope
Applicable to 120, 120/208,
and 120/240 Nominal Voltages
Percent of Nominal Voltage (RMS or Peak Equivalent)
Duration in Seconds (s)
Steady
State
ITI (CBEMA) Curve
100
90
80
70
60
50
40
30
20
10
0
0.05 0.10
0.20 0.50
1.00
Duration of Voltage Sag in Seconds
Perecent of Equipment Nominal Voltage