


© 2011 Schneider Electric. All Rights Reserved.
63230-500-225A2 PowerLogic
TM
Series 800 Power Meter
3/2011 Chapter 9—Disturbance Monitoring (PM870)
67
— Use waveform capture to determine exact disturbance characteristics to compare
with equipment sensitivity
— Justify purchase of power conditioning equipment
— Distinguish between equipment malfunctions and power system related problems
• Develop disturbance prevention methods
— Develop solutions to voltage sensitivity-based problems using actual data
• Work with the utility
— Discuss protection practices with the serving utility and negotiate suitable changes
to shorten the duration of potential sags (reduce interruption time delays on
protective devices)
— Work with the utility to provide alternate “stiffer” services (alternate design practices)
Capabilities of the PM870 During an Event
The PM870 calculates rms magnitudes, based on 128 data points per cycle, every 1/2
cycle. This ensures that even sub-cycle duration rms variations are not missed.
The power meter is configured with 12 default voltage disturbance alarms for all voltage
channels. Current sag and swell alarms are available by configuring custom alarms. A
maximum of 12 disturbance alarms are available. When the PM870 detects a sag or swell,
it can perform the following actions:
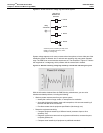
• Perform a waveform capture with a resolution from 185 cycles at 16 samples per
cycle on one channel down to 3 cycles at 128 samples per cycle on all six channels of
the metered current and voltage inputs (see Figure 8–1 on page 63). Use PowerLogic
software to set up the event capture and retrieve the waveform.
• Record the event in the alarm log. When an event occurs, the PM870 updates the
alarm log with an event date and time stamp with 1 millisecond resolution for a sag or
swell pickup, and an rms magnitude corresponding to the most extreme value of the
sag or swell during the event pickup delay. Also, the PM870 can record the sag or swell
dropout in the alarm log at the end of the disturbance. Information stored includes: a
dropout time stamp with 1 millisecond resolution and a second rms magnitude
corresponding to the most extreme value of the sag or swell. Use PowerLogic software
to view the alarm log.
NOTE: The Power Meter display has a 1 second resolution.
• Force a data log entry in up to 3 independent data logs. Use PowerLogic software to
set up and view the data logs.
• Operate any output relays when the event is detected.
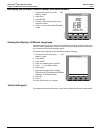
• Indicate the alarm on the display by flashing the maintenance icon to show that a sag
or swell event has occurred.