


© 2011 Schneider Electric. All Rights Reserved.
PowerLogic
TM
Series 800 Power Meter 63230-500-225A2
Chapter 4—Metering Capabilities 3/2011
30
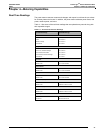
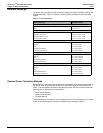
Demand Readings
The power meter provides a variety of demand readings, including coincident readings and
predicted demands. Table 4–2 lists the available demand readings and their reportable
ranges.
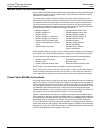
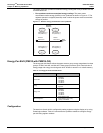
Demand Power Calculation Methods
Demand power is the energy accumulated during a specified period divided by the length of
that period. How the power meter performs this calculation depends on the method you
select. To be compatible with electric utility billing practices, the power meter provides the
following types of demand power calculations:
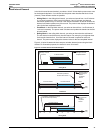
• Block Interval Demand
• Synchronized Demand
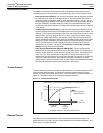
• Thermal Demand
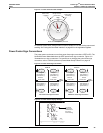
The default demand calculation is set to sliding block with a 15 minute interval. You can set
up any of the demand power calculation methods using PowerLogic software.
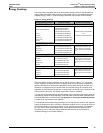
Table 4–2: Demand Readings
Demand Readings Reportable Range
Demand Current, Per-Phase, 3Ø Average, Neutral
Last Complete Interval
Peak
0 to 32,767 A
0 to 32,767 A
Average Power Factor (True), 3Ø Total
Last Complete Interval
Coincident with kW Peak
Coincident with kVAR Peak
Coincident with kVA Peak
–0.002 to 1.000 to +0.002
–0.002 to 1.000 to +0.002
–0.002 to 1.000 to +0.002
–0.002 to 1.000 to +0.002
Demand Real Power, 3Ø Total
Last Complete Interval
Predicted
Peak
Coincident kVA Demand
Coincident kVAR Demand
0 to ± 3276.70 MW
0 to ± 3276.70 MW
0 to ± 3276.70 MW
0 to ± 3276.70 MVA
0 to ± 3276.70 MVAR
Demand Reactive Power, 3Ø Total
Last Complete Interval
Predicted
Peak
Coincident kVA Demand
Coincident kW Demand
0 to ± 3276.70 MVAR
0 to ± 3276.70 MVAR
0 to ± 3276.70 MVAR
0 to ± 3276.70 MVA
0 to ± 3276.70 MW
Demand Apparent Power, 3Ø Total
Last Complete Interval
Predicted
Peak
Coincident kW Demand
Coincident kVAR Demand
0 to ± 3276.70 MVA
0 to ± 3276.70 MVA
0 to ± 3276.70 MVA
0 to ± 3276.70 MW
0 to ± 3276.70 MVAR