


© 2011 Schneider Electric. All Rights Reserved.
PowerLogic
TM
Series 800 Power Meter 63230-500-225A2
Chapter 4—Metering Capabilities 3/2011
28
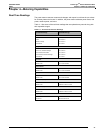
Min/Max Values for Real-time Readings
When certain one-second real-time readings reach their highest or lowest value, the power
meter saves the values in its non-volatile memory. These values are called the minimum
and maximum (min/max) values.
The power meter stores the min/max values for the current month and previous month.
After the end of each month, the power meter moves the current month’s min/max values
into the previous month’s register space and resets the current month’s min/max values.
The current month’s min/max values can be reset manually at any time using the power
meter display or PowerLogic software. After the min/max values are reset, the power meter
records the date and time. The real-time readings evaluated are:
NOTE: Min/Max values for Vng and In are not available from the display. Use the display to
read registers (see “Read and Write Registers” on page 26) or use PowerLogic software.
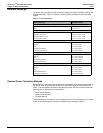
For each min/max value listed above, the power meter records the following attributes:
NOTE: Phase of recorded min/max only applies to multi-phase quantities.
NOTE: There are two ways to view the min/max values. 1- Use the power meter display to
view the min/max values since the meter was last reset. 2- Use PowerLogic software to
view a table with the instantaneous min/max values for the current and previous months.
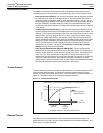
Power Factor Min/Max Conventions
All running min/max values, except for power factor, are arithmetic minimum and maximum
values. For example, the minimum phase A-B voltage is the lowest value in the range 0 to
1200 kV that has occurred since the min/max values were last reset. In contrast, because
the power factor’s midpoint is unity (equal to one), the power factor min/max values are not
true arithmetic minimums and maximums. Instead, the minimum value represents the
measurement closest to -0 on a continuous scale for all real-time readings -0 to 1.00 to +0.
The maximum value is the measurement closest to +0 on the same scale.
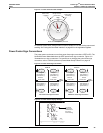
Figure 4–1 shows the min/max values in a typical environment in which a positive power
flow is assumed. In the figure, the minimum power factor is -0.7 (lagging) and the maximum
is 0.8 (leading). Note that the minimum power factor need not be lagging, and the maximum
power factor need not be leading. For example, if the power factor values ranged from
-0.75 to -0.95, then the minimum power factor would be -0.75 (lagging) and the maximum
power factor would be -0.95 (lagging). Both would be negative. Likewise, if the power factor
ranged from +0.9 to +0.95, the minimum would be +0.95 (leading) and the maximum would
be +0.90 (leading). Both would be positive in this case.
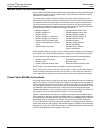
• Min/Max Voltage L-L • Min/Max Reactive Power Total
• Min/Max Voltage L-N • Min/Max Apparent Power Total
• Min/Max Current • Min/Max THD/thd Voltage L-L
• Min/Max Voltage L-L, Unbalance • Min/Max THD/thd Voltage L-N
• Min/Max Voltage L-N, Unbalance • Min/Max THD/thd Current
• Min/Max Total True Power Factor • Min/Max Frequency
• Min/Max Total Displacement Power
Factor
• Min/Max Voltage N-ground
(see the note below)
• Min/Max Real Power Total • Min/Max Current, Neutral
(see the note below)
• Date/Time of minimum value • Date/Time of maximum value
• Minimum value • Maximum value
• Phase of recorded minimum value • Phase of recorded maximum value