APIcom Instruction Manual iDAS Configuration and Data Access
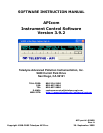
Figure 4-11: Graphing Multiple iDAS Parameters With Different Scales
In the example above, each graph window has a different Y-axis scale that is appropriate for the range
of data values being graphed; as all data stem from the same record set, X-axes are time-aligned.
The primary purpose of the Graph Window is to preview the data. For more sophisticated graphs we
recommend to download and save the data, then import them into e.g., a spreadsheet program.
4.9. Viewing iDAS Data
Data can also be viewed on-screen in table format. To view iDAS data, select one or more parameters
from the same record set or an entire channel and click
. This will display the data in a table
format like that shown in Figure 4-12.
This window can be resized by dragging its edges with the mouse and adjusting the column widths as
needed. APIcom remembers the position and size of the dialog, except for the column layout, which
changes with different parameters.
Figure 4-12: Viewing iDAS Data
Newer versions of the iDAS can store the number of samples in an average. If this option is enabled for
a parameter, there will be an additional column after each parameter showing the number of samples in
each average, as shown in the example below. This extra column will only show after a parameter is
storing the number of samples. Storing the number of samples will decrease the maximum possible
number of data that can be stored in the iDAS!
05499 Rev. A 4-13