


72
MODEL FCL-1056 SECTION 9.0
TROUBLESHOOTING
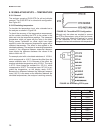
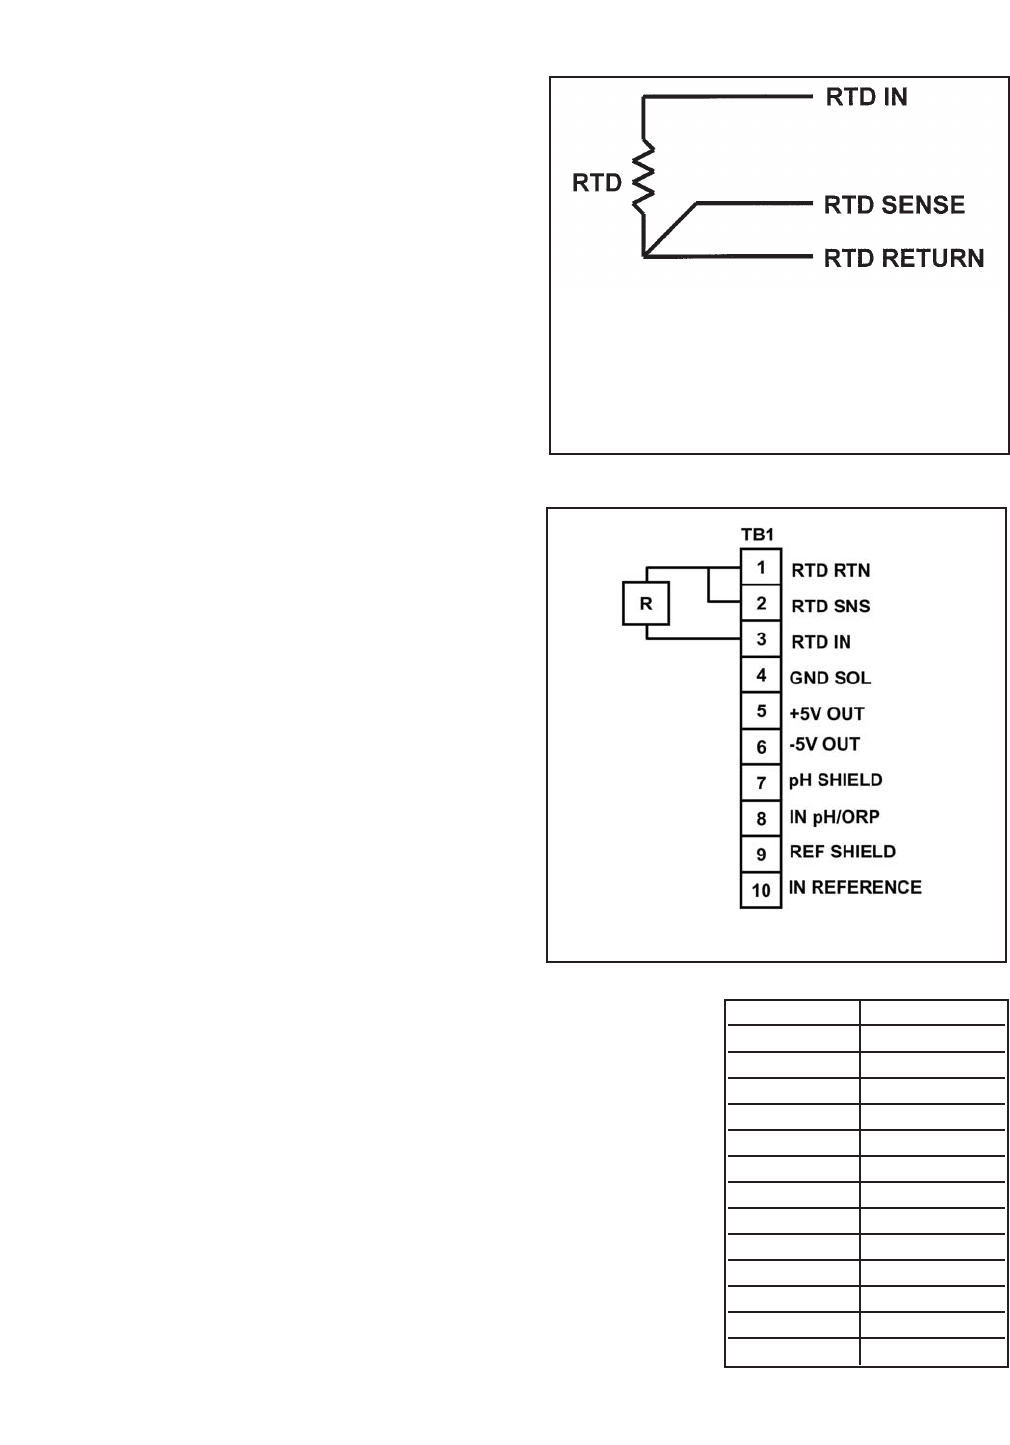
Temp. (°C) Pt 100 (Ω)
0 100.0
10 103.9
20 107.8
25 109.7
30 111.7
40 115.5
50 119.4
60 123.2
70 127.1
80 130.9
85 132.8
90 134.7
100 138.5
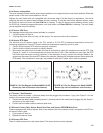
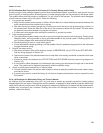
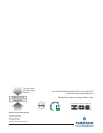
FIGURE 9-6. Simulating RTD Inputs.
9.10 SIMULATING INPUTS — TEMPERATURE
9.10.1 General.
The analyzer accepts a Pt100 RTD (for pH and chlorine
sensors). The Pt100 RTD is in a three-wire configuration.
See Figure 9-5.
9.10.2 Simulating temperature
To simulate the temperature input, wire a decade box to
the analyzer as shown in Figure 9-6.
To check the accuracy of the temperature measurement,
set the resistor simulating the RTD to the values in the
table and note the temperature readings. The measured
temperature might not agree with the value in the table.
During sensor calibration an offset might have been
applied to make the measured temperature agree with a
standard thermometer. The offset is also applied to the
simulated resistance. The analyzer is measuring temperature
correctly if the difference between measured tempera-
tures equals the difference between the values in the
table to within ±0.1°C.
For example, start with a simulated resistance of 103.9 Ω,
which corresponds to 10.0°C. Assume the offset from the
sensor calibration was -0.3 Ω. Because of the offset, the
analyzer calculates temperature using 103.6 Ω. The result
is 9.2°C. Now change the resistance to 107.8 Ω, which
corresponds to 20.0°C. The analyzer uses 107.5 Ω to cal-
culate the temperature, so the display reads 19.2°C.
Because the difference between the displayed tempera-
tures (10.0°C) is the same as the difference between the
simulated temperatures, the analyzer is working correctly.
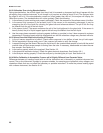
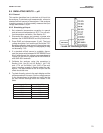
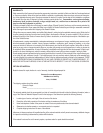
FIGURE 9-5. Three-Wire RTD Configuration.
Although only two wires are required to connect
the RTD to the analyzer, using a third (and some-
times fourth) wire allows the analyzer to correct
for the resistance of the lead wires and for
changes in the lead wire resistance with temperature.