


Chapter 3: Operation 3-9
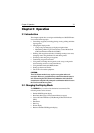
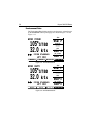
CDI/BDI Data
The Course Deviation Indicator (CDI) / Bearing Deviation Indicator
(BDI) display comprises two data pages, selected alternately by the CDI
and BDI soft keys. These pages are shown in Figure 3-13 and
Figure 3-14:
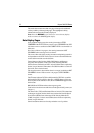
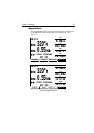
CDI Data
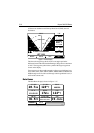
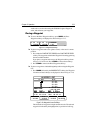
The CDI display shows Cross Track Error (XTE) and Distance to
Waypoint presented in a ‘runway’ format as shown in Figure 3-13:
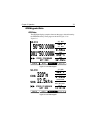
Figure 3-13: CDI Display
The ‘runway’ represents a 0.3nm width with the vessel symbol shown at
the bottom. Individual text boxes show Cross Track Error (XTE),
Bearing to Waypoint, Distance to Waypoint and Time to Go (TTG). TTG
is calculated on the basis of distance to destination and Velocity Made
Good (VMG) towards destination.
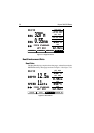
At waypoint ranges greater than 4nm, the symbol remains at the top of the
screen. As the waypoint range falls below 4nm, the symbol moves down
the centre line.
The checkered pattern moves down the screen to simulate movement
when SOG is greater than 2 knots (0.5knots if D-FIX or SD-FIX).
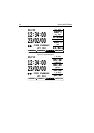
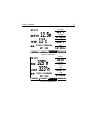
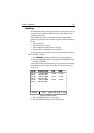
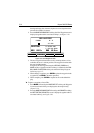
BDI Data
The BDI graphical display shows deviation from the Bearing to
Waypoint and Distance to Waypoint as shown in Figure 3-14. Individual
text boxes show Cross Track Error (XTE), Bearing to Waypoint,
Distance to Waypoint, Time to Go (TTG). TTG is calculated on the basis
D4932-2
XTE
WPT BRG
WPT RNG
TTG
355°T
GOTO CDIROUTE BDI
0.05nm
300°T
23.2nm
04
h:12m
STEER STARBOARD
WPT 004