• Alert Log
• Command Log
Hardware Log
On Dell PowerEdge 9G and 11G systems, use the hardware log to look for potential problems with your system's
hardware components. the hardware log status indicator changes to critical status ( ) when the log file reaches 100
percent capacity. There are two available hardware logs, depending on your system: the Embedded System
Management (ESM) log and the System Event Log (SEL). The ESM log and SEL are each a set of embedded instructions
that can send hardware status messages to systems management software. Each component listed in the logs has a
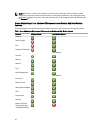
status indicator icon next to its name. The following table lists the status indicators.
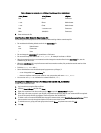
Table 12. Hardware Log Status Indicators
Status Description
A green check mark ( )
Indicates that a component is healthy (normal).
A yellow triangle containing an exclamation point
( )
Indicates that a component has a warning (noncritical)
condition and requires prompt attention.
A red X ( )
Indicates that a component has a failure (critical) condition and
requires immediate attention.
A question mark ( )
Indicates that a component's health status is unknown.
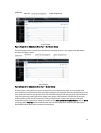
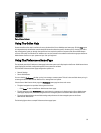
To access the hardware log, click System, click the Logs tab, and click Hardware.
Information displayed in the ESM and SEL logs includes:
• The severity level of the event
• The date and time that the event was captured
• A description of the event
Maintaining The Hardware Log
The status indicator icon next to the log name on the Server Administrator homepage changes from normal status ( )
to noncritical status ( ) when the log file reaches 80 percent capacity. Make sure you clear the hardware log when it
reaches 80 percent capacity. If the log is allowed to reach 100 percent capacity, the latest events are discarded from the
log.
To clear a hardware log, on the Hardware Log page, click the Clear Log link.
Alert Log
NOTE: If the Alert log displays invalid XML data (for example, when the XML data generated for the selection is not
well formed), click Clear Log and then redisplay the log information.
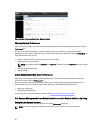
Use the Alert log to monitor various system events. The Server Administrator generates events in response to changes
in the status of sensors and other monitored parameters. Each status change event recorded in the Alert log consists of
a unique identifier called the event ID for a specific event source category and an event message that describes the
event. The event ID and message uniquely describe the severity and cause of the event and provide other relevant
information such as the location of the event and the monitored component's previous state.
To access the Alert log, click System, click the Logs tab, and click Alert.
65