


Page 32 CPV550
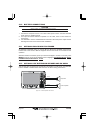
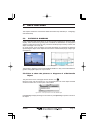
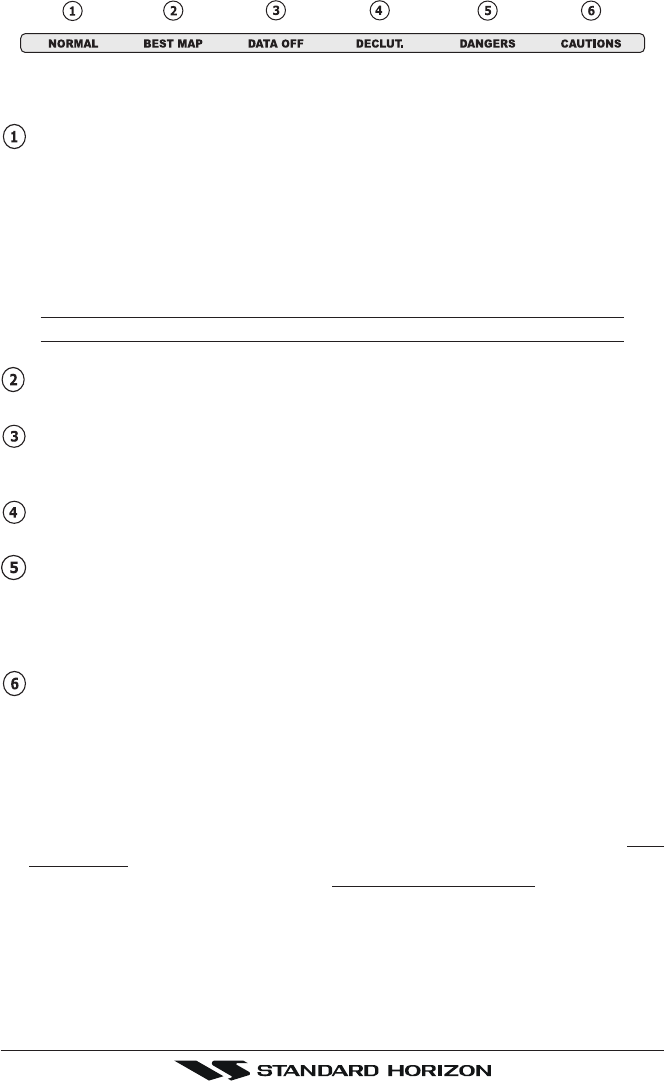
Figure 4.0.4 - Safety Status Bar
Boxes definition is as follows:
Zoom
♦ Normal: when the chart is displayed at normal scale.
♦ U. Zoom: red when the chart is under-zoomed out more than twice normal
scale, gray otherwise.
♦ O. Zoom: red when the chart is over-zoomed in more than twice normal scale,
gray otherwise.
♦ Chart Lock: red when the chart is zoomed in more than twice normal scale,
gray otherwise.
NOTE
U. Zoom, O. Zoom and chart lock are used with Flexi-zoom selected.
Best Scale
Red when a more detailed chart is available under the cursor position.
Data Off
Red when at least one of the following objects or layers is turned off (by the user):
Depths/soundings; Wrecks/obstructions; Tracks/routes; Attention Areas; Nav-Aids.
Declutter
Displays red when clearing overlapping objects.
Dangers
Red when “Guardian Technology” detects one of the following objects: Land, Inter-
tidal, Depth Area, Rocks, Obstructions, Shoreline Constructions, Fishing Facility,
Wrecks, Dragged area, Diffusion area, Mooring facilities, Pingos and Production in-
stallations.
Caution
Red when “Guardian Technology” detects cautionary or restricted area.
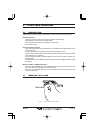
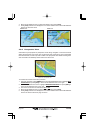
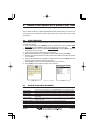
4.0.5 Currents Prediction
It is possible to see the variation of the Tidal arrows on the selected area at any given time.
To activate this function follow the procedure:
1. From the chart page, press [MENU] twice. Move the ShuttlePoint knob to highlight
MAX
FUNCTIONS and press [ENT] or move the ShuttlePoint knob to the right.
2. Move the ShuttlePoint knob to highlight
CURRENTS PREDICTION and press [ENT]
or move the ShuttlePoint knob to the right.
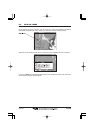
3. A window is shown on the chart. Press [S
ET TIME] to set the date and time manually, and
[I
NCR. TIME]/[DECR. TIME] to increase /decrease time; press [EXIT] to exit.