


48
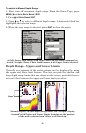
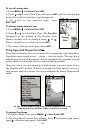
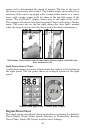
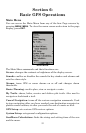
screen aid in determining the depth of targets. The line at the top of
the screen represents the surface. The bottom depth and surface tem-
perature (if the unit is equipped with a temperature sensor or a trans-
ducer with a temp sensor built in) show at the top left corner of the
screen. The FasTrack™ display shows just to the right of the scale.
This changes all echoes into short horizontal bars, replicating a flasher
sonar. The zoom bar on the far right shows the area that's zoomed
when the zoom is in use. (See the Zoom section for more information.)
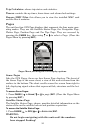
Full Sonar Chart (left). Split Zoom Sonar Chart (right) with left win-
dow zoomed to 4X.
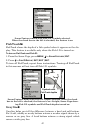
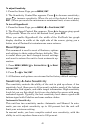
Split Zoom Sonar Chart
A split chart shows the water column from the surface to the bottom in
the right panel. The left panel shows an enlarged version of the right
panel.
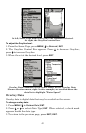
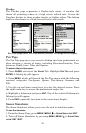
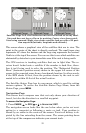
Digital Data page (left). Flasher page (right).
Digital Data/Chart
This mode shows nine digital boxes or windows containing (by default):
Water Depth; Water Temp; Speed; Distance to Destination; Bearing;
Travel Time; Track; Off Course; and the unit's Voltage.