I/O devices
182 Perceive Getting Started
I/O devices
This view shows logical disk volume usage which impacts work in a data center. For
each metric (utilization, response time, I/O Rate, queuing time), the ten highest
logical disk volumes are displayed. It contains the following metrics:
Look for the volumes which simultaneously have high response time and high
utilization or I/O rate.
Configuration
Configuration metrics provide information about the system's configuration during
the selected interval across a zSeries. There is a time-series metric for each numeric
configuration property which can change over time. If the selected time interval
spans more than one configuration, the System Info metric shows the most recent
configuration for the specified interval.
These metrics are available only for Visualizer data sources.
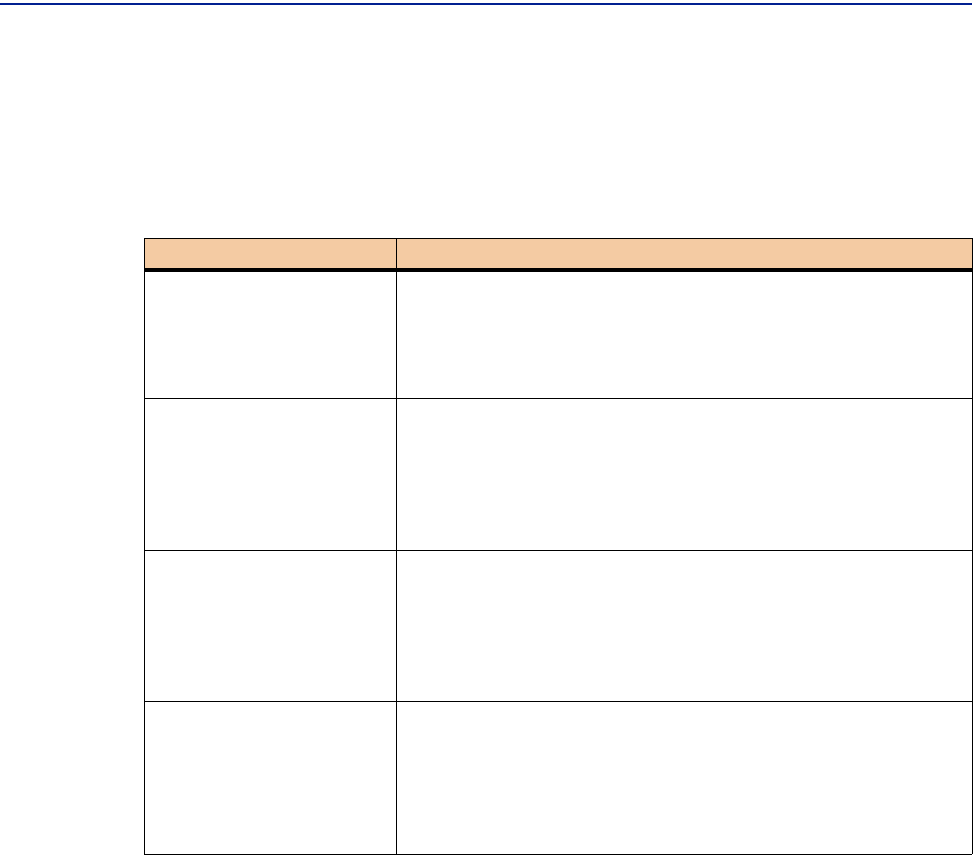
Metric Description
Top 10 Devices by
Utilization
Displays the 10 busiest devices by utilization per computer.
Units: Percent
Default graph: Bar
Top 10 Devices by
Response Time
Displays the 10 busiest devices by response time on the selected
computers.
Units: Msec/IO
Default graph: Bar
Top 10 Devices by I/O
Rate
Displays the expanded storage paging rate on the selected
computers.
Units: Count/sec
Default graph: Bar
Top 10 Devices by
Queuing Time
Displays the expanded storage paging rate on the selected
computers.
Units: Msec/IO
Default graph: Bar


