


24 GPSMAP
®
6000/7000 Series Owner’s Manual
Charts and 3D Chart Views
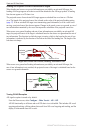
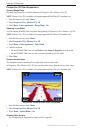
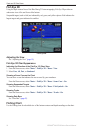
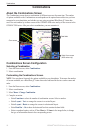
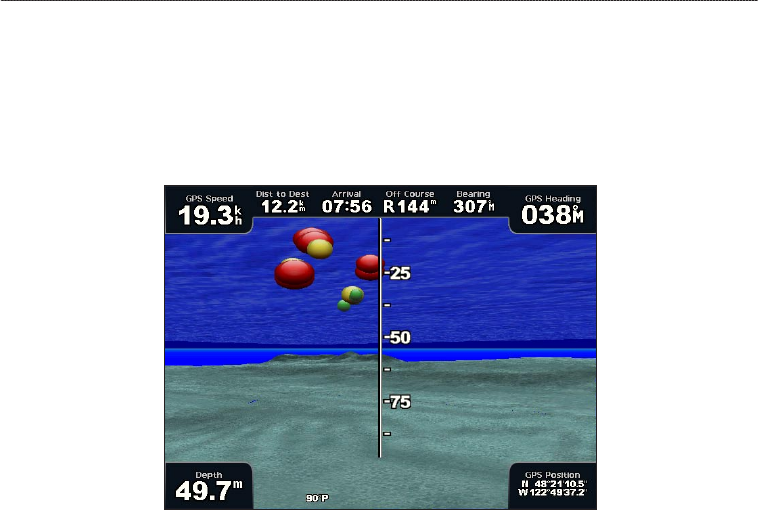
Fish Eye 3D
Using the depth contour lines of the BlueChart g2 Vision cartography, Fish Eye 3D provides an
underwater view of the sea oor or lake bottom.
Suspended targets (such as sh) are indicated by red, green, and yellow spheres. Red indicates the
largest targets and green indicates the smallest.
Fish Eye 3D
Adjusting the View
See “Adjusting the View” (page 19).
Fish Eye 3D Chart Appearance
Indicating the Direction of the Fish Eye 3-D Chart View
1. From the Home screen, select Charts > Fish Eye 3D > Menu > View.
2. Select
Fore, Aft, Port, or Starboard.
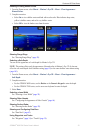
Showing a Sonar Cone on the Chart
You can show a cone that indicates the area covered by your transducer.
From the Home screen, select Charts > Fish Eye 3D > Menu > Sonar Cone > On.
Showing Suspended Targets
From the Home screen, select Charts > Fish Eye 3D > Menu > Fish Symbols > On.
Showing Tracks
From the Home screen, select Charts > Fish Eye 3D > Menu > Tracks > On.
Showing Data Bars
See “Data Bars” (page 62).
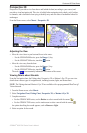
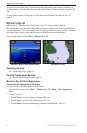
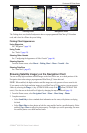
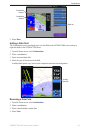
Fishing Chart
Use the Fishing chart for a detailed view of the bottom contours and depth soundings on the chart.