


46 © 2014 Schneider Electric All Rights Reserved
Chapter 5—Viewing Meter Data PowerLogic™ PM5300 series user guide
Related topics
• See “Current demand” on page 81.
Related topics
• See “Power quality” on page 89.
Related topics
• See “Demand” on page 79.
Related topics
• See “Multi-tariff feature overview” on page 83.
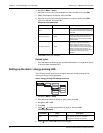
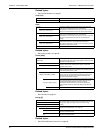
Volts [U-V]
V L-L [U] Line-to-line voltage for each phase.
V L-N [V] Line-to-neutral voltage for each phase.
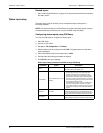
Harm
V L-L [U] Line-to-line voltage harmonics data: Numeric magnitude and
angle for the fundamental harmonic, and graphical
representation of harmonics for the 3rd to 11th, 13th to 21st, and
23rd to 31st odd harmonics for each line-to-line phase voltage.
Fund, 3-11, 13-21, 23-31
V L-N [V] Line-to-neutral voltage harmonics data: Numeric magnitude and
angle for the fundamental harmonic, and graphical
representation of harmonics for the 3rd to 11th, 13th to 21st, and
23rd to 31st odd harmonics for each line-to-neutral phase
voltage.
Fund, 3-11, 13-21, 23-31
Amps [I] Current harmonics data: Numeric magnitude and angle for the
fundamental harmonics, and graphical representation of
harmonics for the 3rd to 11th, 13th to 21st, and 23rd to 31st odd
harmonics for each phase current.
Fund, 3-11, 13-21, 23-31
TDD Total demand distortion for each phase voltage.
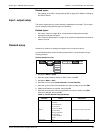
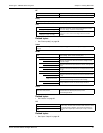
Power [PQS]
Power [PQS]
Summary of real-time power consumption values for total active
power [Ptot] in kW, total reactive power [Qtot] in kVAR, and total
apparent power [Stot] in kVA.
Phase Per phase (A [P1], B [P2], C [P3]) and total (Total [Ptot]) power
values for active power in kW, reactive power in kVAR and
apparent power in kVA.
Active [P], Reac [Q], Appr [S]
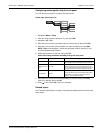
Dmd
Summary of peak power demand values in the previous (Last)
demand interval period for active power in kW, reactive power in
kVAR and apparent power in kVA.
Wd [Pd], VARd [Qd], VAd [Sd]
Total and per phase (A [1], B [2], C [3]) peak power demand
values in the previous (Last) demand interval for active power
demand (Wd [P]), reactive power demand (VARd [Q]) and
apparent power demand (VAd [S]).
Tot, A [P1], B [P2], C [P3]
Each of these sub-screens (total and per phase demand) display
power demand values for the current (Pres) demand interval,
predicted (Pred) demand based on the current power
consumption rate, demand for the previous (Last) demand
interval period, and the recorded peak (Peak) power demand
value.
Pk DT Date and timestamp for the peak (Peak) power demand value.
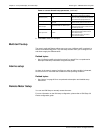
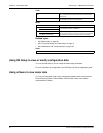
Energy [E]
Wh Delivered (Del), received (Rec), delivered minus received (D+R)
and delivered minus received (D-R) accumulated values for real
energy (Wh), apparent energy (VAh) and reactive energy
(VARh).
VAh
VARh
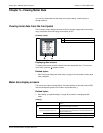
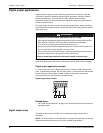
Tariff
Displays the available tariffs (T1 through T4).
T1, T2, T3, T4
Del
Real (Wh), reactive (VARh) and apparent (VAh) energy delivered
values for the selected tariff.
Rec
Real (Wh), reactive (VARh) and apparent (VAh) energy received
values for the selected tariff.