


2. PLOTTER
2-10
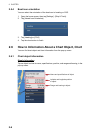
2.9 Cartographic Text and Objects on Vector Charts
This section shows you how to show or hide the cartographic objects and text infor-
mation that appear on the vector charts.
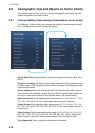
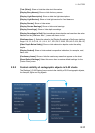
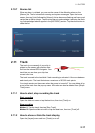
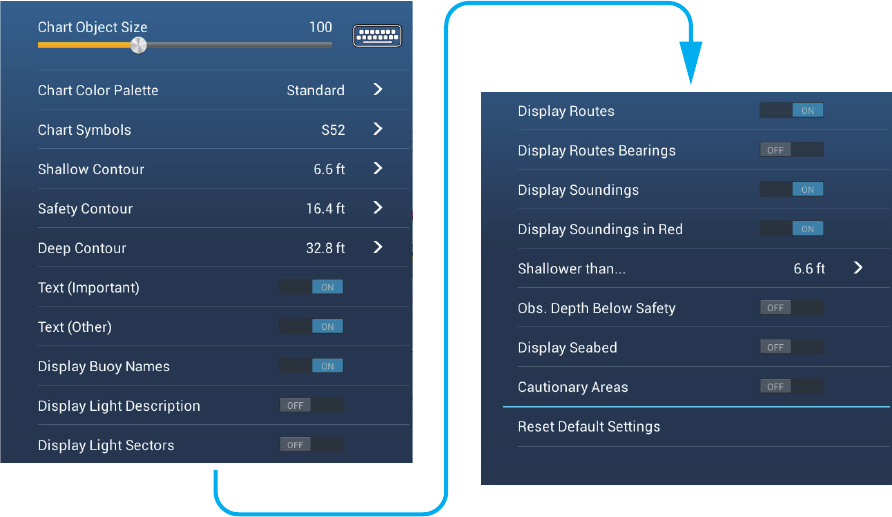
2.9.1 Control visibility of text and object information in vector charts
The [Settings] - [Vector Chart] menu controls the visibility of text and object informa-
tion, for example, buoy names and light description.
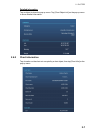
[Chart Object Size]: Drag the slider to set the chart object size (setting value: 50 to
200%).
[Chart Color Palette]: Set the chart color pattern. [Standard] is this equipment’s orig-
inal color palette, [S-52] complies with the official S-52 charts, and [Sunlight] provides
a high contrast palette.
[Chart Symbols]: Select the chart symbol type. [S-52] are the official IMO symbols
(also referred to as simplified symbols) library for ECDIS. [International] symbols are
the copy of paper chart symbols of IALA symbols library (US symbols library).
[Shallow Contour]: Set the shallow depth (setting range: 0.0, 3.3, 6.6, 9.8, 13.1, 16.4,
19.7, 23.0, 26.2, 29.50, 32.8 ft). Show shallow depth contours in dark blue.
[Safety Contour]: Set the safety depth (setting range: 0.0, 3.3, 6.6, 9.8, 13.1, 16.4,
19.7, 23.0, 26.2, 29.50, 32.8, 49.2, 65.6, 98.4, 164 ft). Show safety depth contours in
medium blue.
[Deep Contour]: Set the deep depth (setting range: 0.0, 3.3, 6.6, 9.8, 13.1, 16.4, 19.7,
23.0, 26.2, 29.50, 32.8, 49.2, 65.6, 98.4, 164, 328, 656, 984, 1,640 ft). Show deep-
depth contours in light blue. Depths greater than set here are shown in white.
[Text (Important)]: Show or hide the important text information.
6.0 ft