


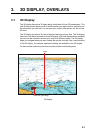

3. 3D DISPLAY, OVERLAYS
3-9
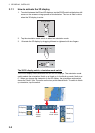
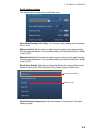
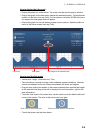
How to display the tide graph
• Display tide graph for a tide station: Tap a tide icon then tap the pop-up window.
• Display tide graph for the tide station nearest the selected position: Tap the desired
position on the chart, then tap [Info]. If a tide station is not within 35 NM of the loca-
tion tapped, the tide graph does not appear.
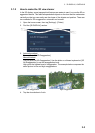
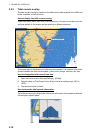
• Display tide graph for the tide station nearest current position: Open the slide-out
menu or the Home screen, then tap [Tide].
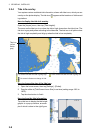
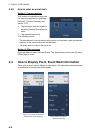
How to read the tide graph
• Vertical axis: Height, Horizontal axis: Time
• The information is mostly accurate under moderate weather conditions. However,
storms and weather fronts can influence forecasted tide times and heights.
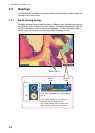
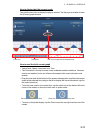
• Drag the time scale at the bottom of the screen sideways then read the tide height
at the selected time (drag to the left to display the future information, right for the
past information).
• To set the time scale to the current time, tap the clock icon at the bottom left-hand
corner of the screen. The color of the clock mark turns gold.
• To exit the screen, tap the close button.
Time scale Tide height at the selected timeClock icon
Clock icon for the current time Clock icon other than the current time