E Comparison Of RT-2 And RT-20
210 MiLLennium Command Descriptions Manual
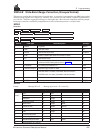
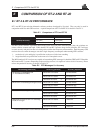
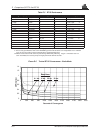
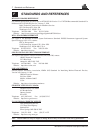
Table E-5 RT-20 Performance
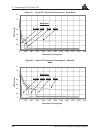
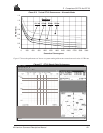
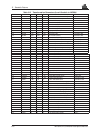
Figure E-5 Typical RT-20 Convergence - Static Mode
Tracking Time (sec) Mode ① Data Delay (sec) Distance (km) Accuracy (CEP)
1 - 180 Static 0 1 100 to 25 cm
180 - 3000 Static 0 1 25 to 5 cm
> 3000 Static 0 1 5 cm or less
➁
1 - 600 Kinematic 0 1 100 to 25 cm
600 - 3000 Kinematic 0 1 25 to 5 cm
> 3000 Kinematic 0 1 5 cm or less ②
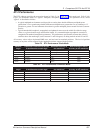
Either 0 - 2 1 +1 cm/sec
Either 2 - 7 1 +2 cm/sec
Either 7 - 30 1 +5 cm/sec
Either 30 - 60 1 +7 cm/sec ③
Either > 60 1 (single point)
Either 0 0 - 10 +0.5 cm/km
Either 0 10 - 20 +0.75 cm/km
Either 0 20 - 50 +1.0 cm/km
① Mode = Static or Kinematic (durin
g
initial ambi
g
uity resolution)
② The accuracy specifications refer to the PRTKA/B lo
g
s which include about 3 cm extrapolation error. RTKA/B
lo
g
s are more accurate but have increased latency associated with them.
③ Between 30 and 60 seconds assumes pseudoran
g
e differential positionin
g
. If Type 1 corrections have not
been transmitted, the accuracy drops to sin
g
le-point mode after 60 seconds.
0
0.2
0.4
0.6
0.8
1
1.2
1.4
0 300 600 900 1200 1500 1800 2100 2400 2700 3000 3300
Seconds of Convergence
CEP(meters)
0.1 km 15 km 25 km 50 km
Baselines


