


CPF180i and CPF300i Page 55
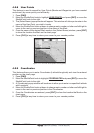
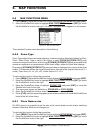
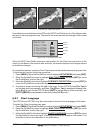
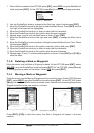
Figure 6.0.6 - Tidal stream arrows
If no data/time is available from the GPS or the GPS Chart Plotter is not in Simulation mode,
the icon on the map is generic one. The color of the arrow denotes the strength of the current
as follows:
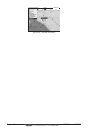
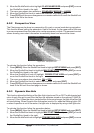
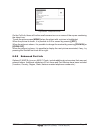
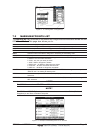
0 to 0.1 kn -
0.2 to 1.0 kn -
1.1 to 2.0 kn -
2.1 to 3.0 kn -
3.1 to 9.9 kn -
Yellow
Yellow
Orange
Orange
Red
Figure 6.0.6a - Tidal stream arrows table
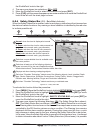
When the GPS Chart Plotter receives a valid position fix, the Tide icons are shown on the
charts on the basis of the current date and time: the screen displays and changes arrows
as date/time changes.
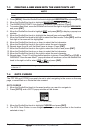
It is possible to see the variation of the Tidal arrows on the selected area at any given time.
To activate this function follow the procedure:
1. Press [MENU]. Move the ShuttlePoint knob to highlight
SETUP MENU and press [ENT].
2. Move the ShuttlePoint knob to highlight
MAX FUNCTIONS and press [ENT] or move
the ShuttlePoint knob to the right.
3. Move the ShuttlePoint knob to highlight
CURRENTS PREDICTION and press [ENT] or
move the ShuttlePoint knob to the right.
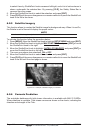
4. A window is shown on the low-left side of the chart. On the CPF300i press [S
ET TIME] to
set the date and time manually, and [I
NCR. TIME]/[DECR. TIME] to decrease/increase time;
press [E
XIT] to exit. On the CPF180i press [ENT] to set the date and time manually, and
[GOTO]/[MENU] to decrease/increase time; press [CLR] to exit.
6.0.7 Chart Language
The CPF180i and CPF300i may be customized to show the local language of the chart.
To select the Chart Language you want:
1. Press [MENU]. Move the ShuttlePoint knob to highlight
SETUP MENU and press [ENT].
2. Move the ShuttlePoint knob to highlight
MAX FUNCTIONS and press [ENT] or move
the ShuttlePoint knob to the right.
3. Move the ShuttlePoint knob to highlight
CHART LANGUAGE and press [ENT] or move
the ShuttlePoint knob to the right. A new popup window will appear on the screen. The
available functions are described in the table below.