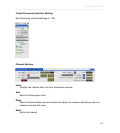
Channel Buttons
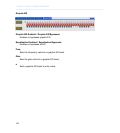
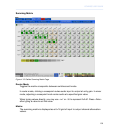
Selects the output channel using buttons 1−16. Muted channels are shown with a dark red
button (bright red when selected).
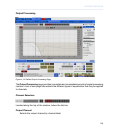
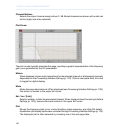
Plot Curve:
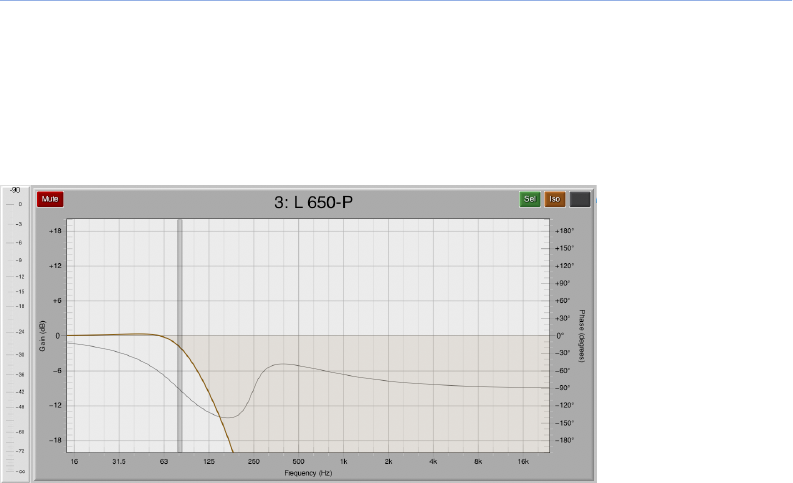
The plot curve(s) typically dominate this page, providing a graphic representation of the frequency
gain curve generated by the EQ parameters.
Meters
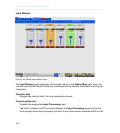
When displayed, shows output signal level for the selected channel or all displayed channels,
dependent on the Processing Interface Settings (p. 122). Click to reset peak hold; Alt+click
to toggle the digital display.
Mute
Mutes the associated channel. When displayed (see Processing Interface Settings (p. 122)),
this button is located in the upper left corner.
Sel / Iso / [Link]
Selects, isolates, or links the associated channel. When displayed (see Processing Interface
Settings (p. 122)), these buttons are located in the upper left corner.
Plot
Shows the frequency/gain curve, control handles, phase response, and other EQ details.
Equalization plot display options are controlled through Processing Interface Settings (p. 122).
The displayed plot is often selected by choosing one of the sub-page tabs.
130
CHAPTER 4: USER INTERFACE REFERENCE


