


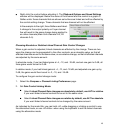

Using Signal Processing
Compass provides composite equalization: you can “layer” various types of equalization, view
the summation result in a graphic plot, and adjust various EQ parameters to achieve the ideal
signal equalization curve.
There are a number of configurable settings specific to the user interface. See Input
Processing (p. 120) and Output Processing (p. 129) for descriptions of these settings.
Selecting Channels
When working with a single or dual plot display:
■
A drop-down channel selector and channel selection buttons are located above the plot.
Use either of these to select the working channel.
When working with multiple EQ plots:
■
Use the Layout, Order, and First controls to select the channel series. See Displaying
Multiple EQ Plots (p. 54), below.
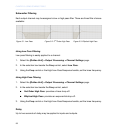
Customizing the Display
Many aspects of the plotter display can be changed, including value ranges, curves, control
handles, number of plots simultaneously displayed, metering, and more. See the Input and
Output Processing sections of the User Interface Reference (p. 71) for details regarding each
setting.
1.
Enable the Settings control, located in the top right corner.
2.
Use the settings available in the Plotter, Handles, and Response pages to control various
aspects of the plot display.
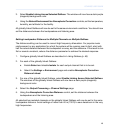
Maximizing the EQ Plot Area
Small-screen users will benefit by maximizing the space available to the EQ plot and controls.
1.
If multiple plots are displayed, enable Settings, select the Plotter page, and beside the
EQ Plots label select Single display.
53
COMPASS USER GUIDE