


Configuring PVCs 4-59
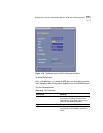
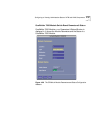
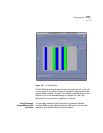
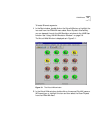
Figure 4-21 VC Path Statistics
The VC Statistics window shows the traffic through each link of the trail
in a bar graph. If the traffic is normal, the height of each bar should be
approximately the same. However if the height of successive bars in the
direction of the flow decreases sharply at a certain link, then that
particular link is the source of congestion on the trail.
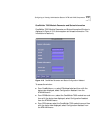
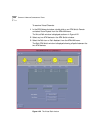
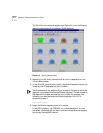
Virtual Channels
Across NNI and UNI
Interfaces
You can easily examine Virtual Channels in the Network-Network
Interface (NNI) and User-Network Interface (UNI) even if the icons are
located on two different Switch Domain windows.