


Displaying Port Level Statistics 7-15
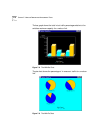
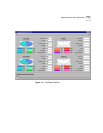
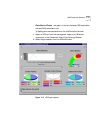
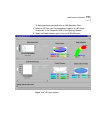
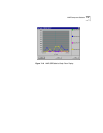
Traffic History graph through the port in frames per second. Four
separated sub-graphs are in the performance window:
Utilization Dial graph of utilization of maximum bandwidth (10Mbps)
of the port.
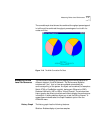
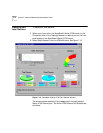
Total Frames Pie chart showing the distribution of all received and
transmitted frames broken down according to the following:
Good Frames Pie chart showing the distribution of valid received and
transmitted frames according to the following:
Table 7-1 Traffic Graphs
Graph Meaning
inGood All valid frames received at the port
inError Errored frames received at the port
outGood All valid frames transmitted from the port
outError Errored frames transmitted from the port
Table 7-2 Total Frames
Graph Meaning
inGood All valid frames received at the port
inError Errored frames received at the port
outGood All valid frames transmitted from the port
outError Errored frames transmitted from the port
Table 7-3 Good Frames
Graph Meaning
inUcast Unicast frames received at the port excluding discards
inNonUcast Broadcast and multicast frames received at the port
excluding discards
outUcast Unicast frames transmitted from the port including
discards
outNonUcast Broadcast and multicast frames transmitted from the
port including discards