


7-16 CHAPTER 7: NETWORK PERFORMANCE MEASUREMENT TASKS
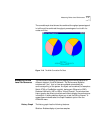
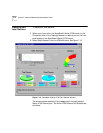
Errored Frames Pie chart showing the distribution of errored received
and transmitted frames according to the following:
LANE Component
Statistics
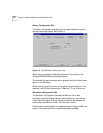
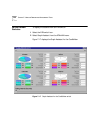
The LANE Component Statistics allow you to measure the performance of
LAN Emulation Services and LAN Emulation Clients in the network.
You can display statistics for the following LAN Emulation Services:
■ LES
■ LEC
■ LANE User
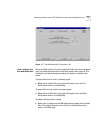
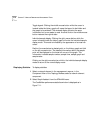
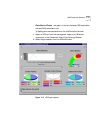
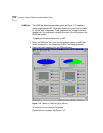
LES Performance The LES performance statistics see Figure 7-13, allow you to see the type
of load that exists on the LAN Emulation Services and to use this
information for load balancing when required.
The LES Performance Statistics are as follows:
Data History graph of transmission rate of Broadcast and Unknown
data (BUS) in Emulated LAN.
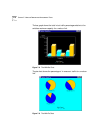
Data Utilization Utilization of the transmission rate of the BUS service
relative to the maximum possible.
Control Frames Pie graph of quality of LE ARPs and other LAN
Emulation control frames handled by LES.
Errored Control Frames Pie graph of errored control frames.
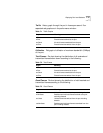
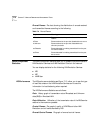
Table 7-4 Errored Frames
Graph Meaning
inDiscards Frames received at the port but discarded for internal
reasons
inErrors Frames received at the port but discarded due to errors
inUnknown Frames received at the port but discarded due to
unknown protocols
outDiscards Frames discarded from being transmitted from the port
for internal reasons
outErrors Frames discarded from being transmitted from the port
due to errors