


Measuring Network -wide ATM Traffic Performance Using the Bandwidth Icon 7-9
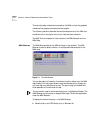
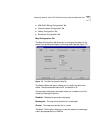
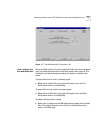
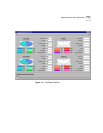
Figure 7-7 The NNIx Simulation Configuration Tab
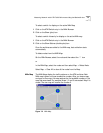
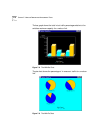
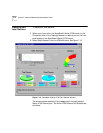
How to Graph Live
Link and Node data
When the NNIx tool is running Link and Node level traffic can be graphed
using the Node performance and Link Performance menu options. This
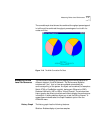
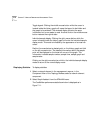
information can be viewed as bar charts, pie charts or cumulative pie
charts.
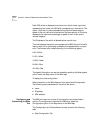
To graph data from all links in the same graph:
■ Select either the Bar, Pie or Cumulative Pie option from the Link
Performance menu in the NNIx Map.
To graph data from all nodes in the same graph:
■ Select either the Bar, Pie or Cumulative Pie option from the Node
Performance menu in the NNIx Map.
To graph individual links or nodes:
■ Select a link or node from the NNIx Map and then select either the Bar,
Pie or Cumulative Pie option from the Link or Node Performance
menu in the NNIx map.