


Measuring Device Level Performance 7-11
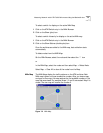
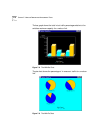
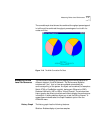
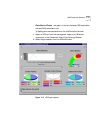
The cumulative pie chart shows the combined throughput percentages of
in traffic and the combined throughput percentages of out traffic for
nodes and links.
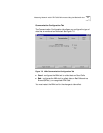
Figure 7-10 The NNIx Cumulative Pie Chart
Measuring Device
Level Performance
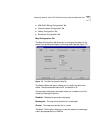
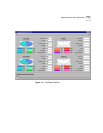
The Performance Statistics windows display performance statistics for
different objects in the ATM Network. The Performance Statistics
windows are “live;” that is, there are updated automatically by
continuous polling of the system. An object can be device (for example a
Switch 2700 or CoreBuilder module), device port (Ethernet or ATM),
Emulated LAN entity (LEC or LES) or Virtual Channel. The windows use
history graphs, bar charts, pie charts and dials to display the performance
information. A sliding selector allows you to set the Polling interval. To
access these windows select the Graph Assistant option from the
ATMvLAN menu.
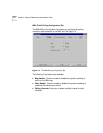
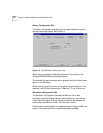
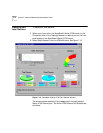
History Graph The history graph has the following features:
Slide bar: Enables display of previous samples.